matplotlib.pyplot.hist2d
-
matplotlib.pyplot.hist2d(x, y, bins=10, range=None, density=False, weights=None, cmin=None, cmax=None, *, data=None, **kwargs)[source]¶ Make a 2D histogram plot.
Parameters: - x, yarray-like, shape (n, )
Input values
- binsNone or int or [int, int] or array-like or [array, array]
The bin specification:
- If int, the number of bins for the two dimensions (nx=ny=bins).
- If
[int, int], the number of bins in each dimension (nx, ny = bins). - If array-like, the bin edges for the two dimensions (x_edges=y_edges=bins).
- If
[array, array], the bin edges in each dimension (x_edges, y_edges = bins).
The default value is 10.
- rangearray-like shape(2, 2), optional
The leftmost and rightmost edges of the bins along each dimension (if not specified explicitly in the bins parameters):
[[xmin,
xmax], [ymin, ymax]]
. All values outside of this range will be considered outliers and not tallied in the histogram.- densitybool, default: False
Normalize histogram. See the documentation for the density parameter of
histfor more details.- weightsarray-like, shape (n, ), optional
An array of values w_i weighing each sample (x_i, y_i).
- cmin, cmaxfloat, default: None
All bins that has count less than cmin or more than cmax will not be displayed (set to NaN before passing to imshow) and these count values in the return value count histogram will also be set to nan upon return.
Returns: - h2D array
The bi-dimensional histogram of samples x and y. Values in x are histogrammed along the first dimension and values in y are histogrammed along the second dimension.
- xedges1D array
The bin edges along the x axis.
- yedges1D array
The bin edges along the y axis.
- image
QuadMesh
Other Parameters: - cmapColormap or str, optional
A
colors.Colormapinstance. If not set, use rc settings.- normNormalize, optional
A
colors.Normalizeinstance is used to scale luminance data to[0, 1]. If not set, defaults tocolors.Normalize().- vmin/vmaxNone or scalar, optional
Arguments passed to the
Normalizeinstance.- alpha
0 <= scalar <= 1orNone, optional The alpha blending value.
- **kwargs
Additional parameters are passed along to the
pcolormeshmethod andQuadMeshconstructor.
See also
hist- 1D histogram plotting
Notes
- Currently
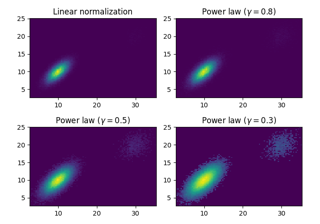
hist2dcalculates its own axis limits, and any limits previously set are ignored. - Rendering the histogram with a logarithmic color scale is
accomplished by passing a
colors.LogNorminstance to the norm keyword argument. Likewise, power-law normalization (similar in effect to gamma correction) can be accomplished withcolors.PowerNorm.
Note
In addition to the above described arguments, this function can take a data keyword argument. If such a data argument is given, the following arguments can also be string
s, which is interpreted asdata[s](unless this raises an exception): x, y, weights.Objects passed as data must support item access (
data[s]) and membership test (s in data).