matplotlib.axes.Axes.pcolormesh
-
Axes.pcolormesh(self, *args, alpha=None, norm=None, cmap=None, vmin=None, vmax=None, shading=None, antialiased=False, data=None, **kwargs)[source]¶ Create a pseudocolor plot with a non-regular rectangular grid.
Call signature:
pcolormesh([X, Y,] C, **kwargs)
X and Y can be used to specify the corners of the quadrilaterals.
Hint
pcolormeshis similar topcolor. It is much faster and preferred in most cases. For a detailed discussion on the differences see Differences between pcolor() and pcolormesh().Parameters: - Carray-like
A scalar 2-D array. The values will be color-mapped.
- X, Yarray-like, optional
The coordinates of the corners of quadrilaterals of a pcolormesh:
(X[i+1, j], Y[i+1, j])       (X[i+1, j+1], Y[i+1, j+1])
                      +-----+
                      |     |
                      +-----+
    (X[i, j], Y[i, j])       (X[i, j+1], Y[i, j+1])
Note that the column index corresponds to the x-coordinate, and the row index corresponds to y. For details, see the Notes section below.
If
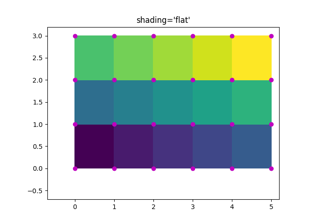
shading='flat'the dimensions of X and Y should be one greater than those of C, and the quadrilateral is colored due to the value atC[i, j]. If X, Y and C have equal dimensions, a warning will be raised and the last row and column of C will be ignored.If
shading='nearest'or'gouraud', the dimensions of X and Y should be the same as those of C (if not, a ValueError will be raised). For'nearest'the colorC[i, j]is centered on(X[i, j], Y[i, j]). For'gouraud', a smooth interpolation is caried out between the quadrilateral corners.If X and/or Y are 1-D arrays or column vectors they will be expanded as needed into the appropriate 2-D arrays, making a rectangular grid.
- cmapstr or
Colormap, default:rcParams["image.cmap"](default:'viridis') A Colormap instance or registered colormap name. The colormap maps the C values to colors.
- norm
Normalize, optional The Normalize instance scales the data values to the canonical colormap range [0, 1] for mapping to colors. By default, the data range is mapped to the colorbar range using linear scaling.
- vmin, vmaxfloat, default: None
The colorbar range. If None, suitable min/max values are automatically chosen by the
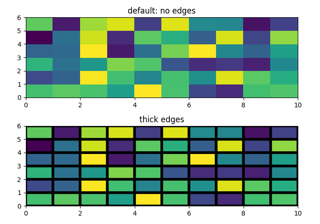
Normalizeinstance (defaults to the respective min/max values of C in case of the default linear scaling). It is deprecated to use vmin/vmax when norm is given.- edgecolors{'none', None, 'face', color, color sequence}, optional
The color of the edges. Defaults to 'none'. Possible values:
- 'none' or '': No edge.
- None:
rcParams["patch.edgecolor"](default:'black') will be used. Note that currentlyrcParams["patch.force_edgecolor"](default:False) has to be True for this to work. - 'face': Use the adjacent face color.
- A color or sequence of colors will set the edge color.
The singular form edgecolor works as an alias.
- alphafloat, default: None
The alpha blending value, between 0 (transparent) and 1 (opaque).
- shading{'flat', 'nearest', 'gouraud', 'auto'}, optional
The fill style for the quadrilateral; defaults to 'flat' or
rcParams["pcolor.shading"](default:'flat'). Possible values:- 'flat': A solid color is used for each quad. The color of the
quad (i, j), (i+1, j), (i, j+1), (i+1, j+1) is given by
C[i, j]. The dimensions of X and Y should be one greater than those of C; if they are the same as C, then a deprecation warning is raised, and the last row and column of C are dropped. - 'nearest': Each grid point will have a color centered on it, extending halfway between the adjacent grid centers. The dimensions of X and Y must be the same as C.
- 'gouraud': Each quad will be Gouraud shaded: The color of the
corners (i', j') are given by
C[i', j']. The color values of the area in between is interpolated from the corner values. The dimensions of X and Y must be the same as C. When Gouraud shading is used, edgecolors is ignored. - 'auto': Choose 'flat' if dimensions of X and Y are one larger than C. Choose 'nearest' if dimensions are the same.
See pcolormesh grids and shading for more description.
- 'flat': A solid color is used for each quad. The color of the
quad (i, j), (i+1, j), (i, j+1), (i+1, j+1) is given by
- snapbool, default: False
Whether to snap the mesh to pixel boundaries.
Returns: Other Parameters: - **kwargs
Additionally, the following arguments are allowed. They are passed along to the
QuadMeshconstructor:Property Description agg_filtera filter function, which takes a (m, n, 3) float array and a dpi value, and returns a (m, n, 3) array alphafloat or None animatedbool antialiasedor aa or antialiasedsbool or list of bools arrayndarray capstyle{'butt', 'round', 'projecting'} clim(vmin: float, vmax: float) clip_boxBboxclip_onbool clip_pathPatch or (Path, Transform) or None cmapColormapor str or Nonecolorcolor or list of rgba tuples containsunknown edgecoloror ec or edgecolorscolor or list of colors or 'face' facecoloror facecolors or fccolor or list of colors figureFiguregidstr hatch{'/', '\', '|', '-', '+', 'x', 'o', 'O', '.', '*'} in_layoutbool joinstyle{'miter', 'round', 'bevel'} labelobject linestyleor dashes or linestyles or lsstr or tuple or list thereof linewidthor linewidths or lwfloat or list of floats normNormalizeor Noneoffset_positionunknown offsetsarray-like (N, 2) or (2,) path_effectsAbstractPathEffectpickerNone or bool or callable pickradiusunknown rasterizedbool or None sketch_params(scale: float, length: float, randomness: float) snapbool or None transformTransformurlstr urlslist of str or None visiblebool zorderfloat
See also
pcolor- An alternative implementation with slightly different features. For a detailed discussion on the differences see Differences between pcolor() and pcolormesh().
imshow- If X and Y are each equidistant,
imshowcan be a faster alternative.
Notes
Masked arrays
C may be a masked array. If
C[i, j]is masked, the corresponding quadrilateral will be transparent. Masking of X and Y is not supported. Usepcolorif you need this functionality.Grid orientation
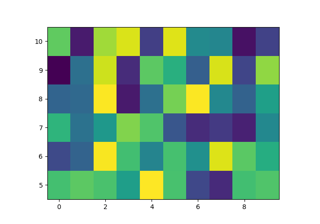
The grid orientation follows the standard matrix convention: An array C with shape (nrows, ncolumns) is plotted with the column number as X and the row number as Y.
Differences between pcolor() and pcolormesh()
Both methods are used to create a pseudocolor plot of a 2-D array using quadrilaterals.
The main difference lies in the created object and internal data handling: While
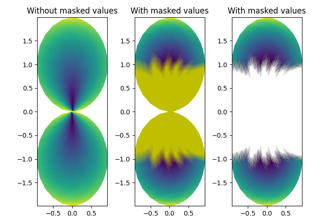
pcolorreturns aPolyCollection,pcolormeshreturns aQuadMesh. The latter is more specialized for the given purpose and thus is faster. It should almost always be preferred.There is also a slight difference in the handling of masked arrays. Both
pcolorandpcolormeshsupport masked arrays for C. However, onlypcolorsupports masked arrays for X and Y. The reason lies in the internal handling of the masked values.pcolorleaves out the respective polygons from the PolyCollection.pcolormeshsets the facecolor of the masked elements to transparent. You can see the difference when using edgecolors. While all edges are drawn irrespective of masking in a QuadMesh, the edge between two adjacent masked quadrilaterals inpcoloris not drawn as the corresponding polygons do not exist in the PolyCollection.Another difference is the support of Gouraud shading in
pcolormesh, which is not available withpcolor.Note
In addition to the above described arguments, this function can take a data keyword argument. If such a data argument is given, every other argument can also be string
s, which is interpreted asdata[s](unless this raises an exception).Objects passed as data must support item access (
data[s]) and membership test (s in data).