Note
Click here to download the full example code
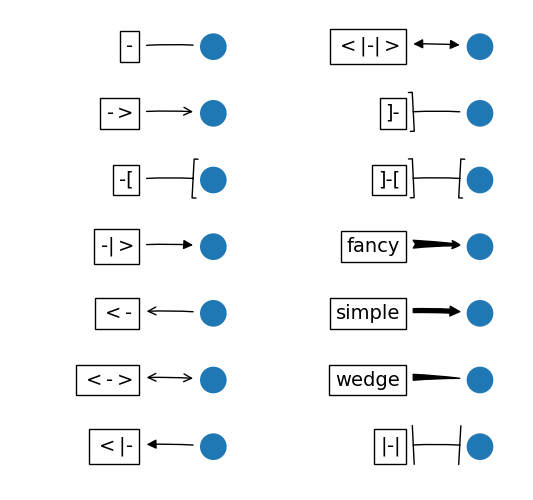
Fancyarrow Demo
import matplotlib.patches as mpatches
import matplotlib.pyplot as plt

styles = mpatches.ArrowStyle.get_styles()

ncol = 2
nrow = (len(styles) + 1) // ncol
figheight = (nrow + 0.5)
fig = plt.figure(figsize=(4 * ncol / 1.5, figheight / 1.5))
fontsize = 0.2 * 70


ax = fig.add_axes([0, 0, 1, 1], frameon=False, aspect=1.)

ax.set_xlim(0, 4 * ncol)
ax.set_ylim(0, figheight)


def to_texstring(s):
    s = s.replace("<", r"$<$")
    s = s.replace(">", r"$>$")
    s = s.replace("|", r"$|$")
    return s


for i, (stylename, styleclass) in enumerate(sorted(styles.items())):
    x = 3.2 + (i // nrow) * 4
    y = (figheight - 0.7 - i % nrow)  # /figheight
    p = mpatches.Circle((x, y), 0.2)
    ax.add_patch(p)

    ax.annotate(to_texstring(stylename), (x, y),
                (x - 1.2, y),
                ha="right", va="center",
                size=fontsize,
                arrowprops=dict(arrowstyle=stylename,
                                patchB=p,
                                shrinkA=5,
                                shrinkB=5,
                                fc="k", ec="k",
                                connectionstyle="arc3,rad=-0.05",
                                ),
                bbox=dict(boxstyle="square", fc="w"))

ax.xaxis.set_visible(False)
ax.yaxis.set_visible(False)

plt.show()
References
The use of the following functions, methods, classes and modules is shown in this example:
import matplotlib
matplotlib.patches
matplotlib.patches.ArrowStyle
matplotlib.patches.ArrowStyle.get_styles
matplotlib.axes.Axes.annotate
Out:
<function Axes.annotate at 0x7f08bbc3c160>
Keywords: matplotlib code example, codex, python plot, pyplot Gallery generated by Sphinx-Gallery