matplotlib.figure.Figure
-
class
matplotlib.figure.Figure(figsize=None, dpi=None, facecolor=None, edgecolor=None, linewidth=0.0, frameon=None, subplotpars=None, tight_layout=None, constrained_layout=None)[source]¶ Bases:
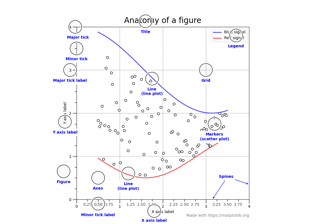
matplotlib.artist.ArtistThe top level container for all the plot elements.
The Figure instance supports callbacks through a callbacks attribute which is a
CallbackRegistryinstance. The events you can connect to are 'dpi_changed', and the callback will be called withfunc(fig)where fig is theFigureinstance.Attributes: - patch
The
Rectangleinstance representing the figure background patch.- suppressComposite
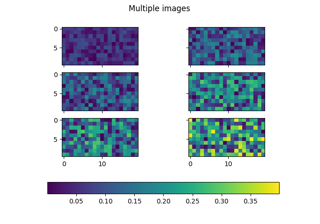
For multiple figure images, the figure will make composite images depending on the renderer option_image_nocomposite function. If suppressComposite is a boolean, this will override the renderer.
Parameters: - figsize2-tuple of floats, default:
rcParams["figure.figsize"](default:[6.4, 4.8]) Figure dimension
(width, height)in inches.- dpifloat, default:
rcParams["figure.dpi"](default:100.0) Dots per inch.
- facecolordefault:
rcParams["figure.facecolor"](default:'white') The figure patch facecolor.
- edgecolordefault:
rcParams["figure.edgecolor"](default:'white') The figure patch edge color.
- linewidthfloat
The linewidth of the frame (i.e. the edge linewidth of the figure patch).
- frameonbool, default:
rcParams["figure.frameon"](default:True) If
False, suppress drawing the figure background patch.- subplotpars
SubplotParams Subplot parameters. If not given, the default subplot parameters
rcParams["figure.subplot.*"]are used.- tight_layoutbool or dict, default:
rcParams["figure.autolayout"](default:False) If
Falseuse subplotpars. IfTrueadjust subplot parameters usingtight_layoutwith default padding. When providing a dict containing the keyspad,w_pad,h_pad, andrect, the defaulttight_layoutpaddings will be overridden.- constrained_layoutbool, default:
rcParams["figure.constrained_layout.use"](default:False) If
Trueuse constrained layout to adjust positioning of plot elements. Liketight_layout, but designed to be more flexible. See Constrained Layout Guide for examples. (Note: does not work withadd_subplotorsubplot2grid.)
-
__init__(self, figsize=None, dpi=None, facecolor=None, edgecolor=None, linewidth=0.0, frameon=None, subplotpars=None, tight_layout=None, constrained_layout=None)[source]¶ Parameters: - figsize2-tuple of floats, default:
rcParams["figure.figsize"](default:[6.4, 4.8]) Figure dimension
(width, height)in inches.- dpifloat, default:
rcParams["figure.dpi"](default:100.0) Dots per inch.
- facecolordefault:
rcParams["figure.facecolor"](default:'white') The figure patch facecolor.
- edgecolordefault:
rcParams["figure.edgecolor"](default:'white') The figure patch edge color.
- linewidthfloat
The linewidth of the frame (i.e. the edge linewidth of the figure patch).
- frameonbool, default:
rcParams["figure.frameon"](default:True) If
False, suppress drawing the figure background patch.- subplotpars
SubplotParams Subplot parameters. If not given, the default subplot parameters
rcParams["figure.subplot.*"]are used.- tight_layoutbool or dict, default:
rcParams["figure.autolayout"](default:False) If
Falseuse subplotpars. IfTrueadjust subplot parameters usingtight_layoutwith default padding. When providing a dict containing the keyspad,w_pad,h_pad, andrect, the defaulttight_layoutpaddings will be overridden.- constrained_layoutbool, default:
rcParams["figure.constrained_layout.use"](default:False) If
Trueuse constrained layout to adjust positioning of plot elements. Liketight_layout, but designed to be more flexible. See Constrained Layout Guide for examples. (Note: does not work withadd_subplotorsubplot2grid.)
- figsize2-tuple of floats, default:
-
__module__= 'matplotlib.figure'
-
add_artist(self, artist, clip=False)[source]¶ Add an
Artistto the figure.Usually artists are added to axes objects using
Axes.add_artist; this method can be used in the rare cases where one needs to add artists directly to the figure instead.Parameters: - artist
Artist The artist to add to the figure. If the added artist has no transform previously set, its transform will be set to
figure.transFigure.- clipbool, default: False
Whether the added artist should be clipped by the figure patch.
Returns: ArtistThe added artist.
- artist
-
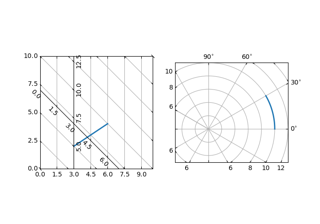
add_axes(self, *args, **kwargs)[source]¶ Add an axes to the figure.
Call signatures:
add_axes(rect, projection=None, polar=False, **kwargs)
add_axes(ax)
Parameters: - rectsequence of float
The dimensions [left, bottom, width, height] of the new axes. All quantities are in fractions of figure width and height.
- projection{None, 'aitoff', 'hammer', 'lambert', 'mollweide', 'polar', 'rectilinear', str}, optional
The projection type of the
Axes. str is the name of a custom projection, seeprojections. The default None results in a 'rectilinear' projection.- polarbool, default: False
If True, equivalent to projection='polar'.
- sharex, sharey
Axes, optional Share the x or y
axiswith sharex and/or sharey. The axis will have the same limits, ticks, and scale as the axis of the shared axes.- labelstr
A label for the returned axes.
Returns: Axes, or a subclass ofAxesThe returned axes class depends on the projection used. It is
Axesif rectilinear projection is used andprojections.polar.PolarAxesif polar projection is used.
Other Parameters: - **kwargs
This method also takes the keyword arguments for the returned axes class. The keyword arguments for the rectilinear axes class
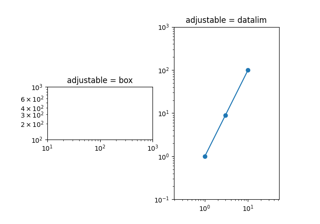
Axescan be found in the following table but there might also be other keyword arguments if another projection is used, see the actual axes class.Property Description adjustable{'box', 'datalim'} agg_filtera filter function, which takes a (m, n, 3) float array and a dpi value, and returns a (m, n, 3) array alphafloat or None anchor2-tuple of floats or {'C', 'SW', 'S', 'SE', ...} animatedbool aspect{'auto'} or num autoscale_onbool autoscalex_onbool autoscaley_onbool axes_locatorCallable[[Axes, Renderer], Bbox] axisbelowbool or 'line' box_aspectNone, or a number clip_boxBboxclip_onbool clip_pathPatch or (Path, Transform) or None containsunknown facecoloror fccolor figureFigureframe_onbool gidstr in_layoutbool labelobject navigatebool navigate_modeunknown path_effectsAbstractPathEffectpickerNone or bool or callable position[left, bottom, width, height] or Bboxprop_cycleunknown rasterization_zorderfloat or None rasterizedbool or None sketch_params(scale: float, length: float, randomness: float) snapbool or None titlestr transformTransformurlstr visiblebool xboundunknown xlabelstr xlim(bottom: float, top: float) xmarginfloat greater than -0.5 xscale{"linear", "log", "symlog", "logit", ...} xticklabelsunknown xticksunknown yboundunknown ylabelstr ylim(bottom: float, top: float) ymarginfloat greater than -0.5 yscale{"linear", "log", "symlog", "logit", ...} yticklabelsunknown yticksunknown zorderfloat
Notes
If the figure already has an axes with key (args, kwargs) then it will simply make that axes current and return it. This behavior is deprecated. Meanwhile, if you do not want this behavior (i.e., you want to force the creation of a new axes), you must use a unique set of args and kwargs. The axes label attribute has been exposed for this purpose: if you want two axes that are otherwise identical to be added to the figure, make sure you give them unique labels.
In rare circumstances,
add_axesmay be called with a single argument, a axes instance already created in the present figure but not in the figure's list of axes.Examples
Some simple examples:
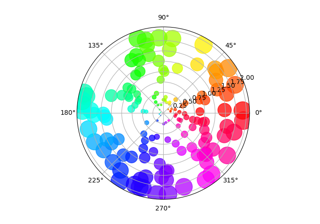
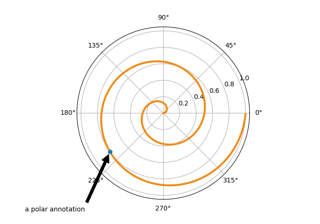
rect = l, b, w, h
fig = plt.figure()
fig.add_axes(rect, label=label1)
fig.add_axes(rect, label=label2)
fig.add_axes(rect, frameon=False, facecolor='g')
fig.add_axes(rect, polar=True)
ax = fig.add_axes(rect, projection='polar')
fig.delaxes(ax)
fig.add_axes(ax)
-
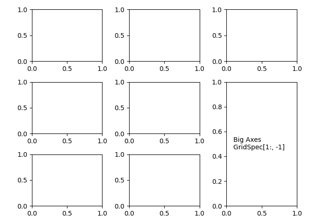
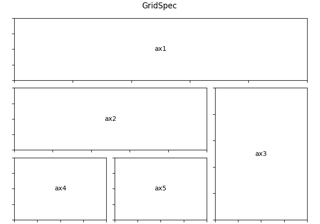
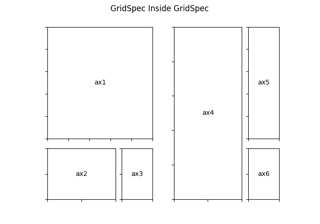
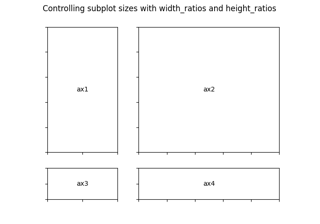
add_gridspec(self, nrows=1, ncols=1, **kwargs)[source]¶ Return a
GridSpecthat has this figure as a parent. This allows complex layout of axes in the figure.Parameters: - nrowsint, default: 1
Number of rows in grid.
- ncolsint, default: 1
Number or columns in grid.
Returns: Other Parameters: - **kwargs
Keyword arguments are passed to
GridSpec.
See also
Examples
Adding a subplot that spans two rows:
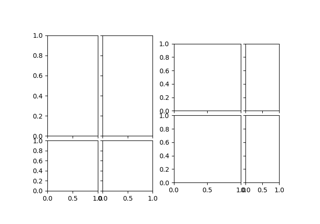
fig = plt.figure()
gs = fig.add_gridspec(2, 2)
ax1 = fig.add_subplot(gs[0, 0])
ax2 = fig.add_subplot(gs[1, 0])
# spans two rows:
ax3 = fig.add_subplot(gs[:, 1])
-
add_subplot(self, *args, **kwargs)[source]¶ Add an
Axesto the figure as part of a subplot arrangement.Call signatures:
add_subplot(nrows, ncols, index, **kwargs)
add_subplot(pos, **kwargs)
add_subplot(ax)
add_subplot()
Parameters: - *argsint, (int, int, index), or
SubplotSpec, default: (1, 1, 1) The position of the subplot described by one of
- Three integers (nrows, ncols, index). The subplot will
take the index position on a grid with nrows rows and
ncols columns. index starts at 1 in the upper left corner
and increases to the right. index can also be a two-tuple
specifying the (first, last) indices (1-based, and including
last) of the subplot, e.g.,
fig.add_subplot(3, 1, (1, 2))makes a subplot that spans the upper 2/3 of the figure. - A 3-digit integer. The digits are interpreted as if given
separately as three single-digit integers, i.e.
fig.add_subplot(235)is the same asfig.add_subplot(2, 3, 5). Note that this can only be used if there are no more than 9 subplots. - A
SubplotSpec.
In rare circumstances,
add_subplotmay be called with a single argument, a subplot axes instance already created in the present figure but not in the figure's list of axes.- Three integers (nrows, ncols, index). The subplot will
take the index position on a grid with nrows rows and
ncols columns. index starts at 1 in the upper left corner
and increases to the right. index can also be a two-tuple
specifying the (first, last) indices (1-based, and including
last) of the subplot, e.g.,
- projection{None, 'aitoff', 'hammer', 'lambert', 'mollweide', 'polar', 'rectilinear', str}, optional
The projection type of the subplot (
Axes). str is the name of a custom projection, seeprojections. The default None results in a 'rectilinear' projection.- polarbool, default: False
If True, equivalent to projection='polar'.
- sharex, sharey
Axes, optional Share the x or y
axiswith sharex and/or sharey. The axis will have the same limits, ticks, and scale as the axis of the shared axes.- labelstr
A label for the returned axes.
Returns: axes.SubplotBase, or another subclass ofAxesThe axes of the subplot. The returned axes base class depends on the projection used. It is
Axesif rectilinear projection is used andprojections.polar.PolarAxesif polar projection is used. The returned axes is then a subplot subclass of the base class.
Other Parameters: - **kwargs
This method also takes the keyword arguments for the returned axes base class; except for the figure argument. The keyword arguments for the rectilinear base class
Axescan be found in the following table but there might also be other keyword arguments if another projection is used.Property Description adjustable{'box', 'datalim'} agg_filtera filter function, which takes a (m, n, 3) float array and a dpi value, and returns a (m, n, 3) array alphafloat or None anchor2-tuple of floats or {'C', 'SW', 'S', 'SE', ...} animatedbool aspect{'auto'} or num autoscale_onbool autoscalex_onbool autoscaley_onbool axes_locatorCallable[[Axes, Renderer], Bbox] axisbelowbool or 'line' box_aspectNone, or a number clip_boxBboxclip_onbool clip_pathPatch or (Path, Transform) or None containsunknown facecoloror fccolor figureFigureframe_onbool gidstr in_layoutbool labelobject navigatebool navigate_modeunknown path_effectsAbstractPathEffectpickerNone or bool or callable position[left, bottom, width, height] or Bboxprop_cycleunknown rasterization_zorderfloat or None rasterizedbool or None sketch_params(scale: float, length: float, randomness: float) snapbool or None titlestr transformTransformurlstr visiblebool xboundunknown xlabelstr xlim(bottom: float, top: float) xmarginfloat greater than -0.5 xscale{"linear", "log", "symlog", "logit", ...} xticklabelsunknown xticksunknown yboundunknown ylabelstr ylim(bottom: float, top: float) ymarginfloat greater than -0.5 yscale{"linear", "log", "symlog", "logit", ...} yticklabelsunknown yticksunknown zorderfloat
Notes
If the figure already has a subplot with key (args, kwargs) then it will simply make that subplot current and return it. This behavior is deprecated. Meanwhile, if you do not want this behavior (i.e., you want to force the creation of a new subplot), you must use a unique set of args and kwargs. The axes label attribute has been exposed for this purpose: if you want two subplots that are otherwise identical to be added to the figure, make sure you give them unique labels.
Examples
fig = plt.figure()

fig.add_subplot(231)
ax1 = fig.add_subplot(2, 3, 1)  # equivalent but more general

fig.add_subplot(232, frameon=False)  # subplot with no frame
fig.add_subplot(233, projection='polar')  # polar subplot
fig.add_subplot(234, sharex=ax1)  # subplot sharing x-axis with ax1
fig.add_subplot(235, facecolor="red")  # red subplot

ax1.remove()  # delete ax1 from the figure
fig.add_subplot(ax1)  # add ax1 back to the figure
- *argsint, (int, int, index), or
-
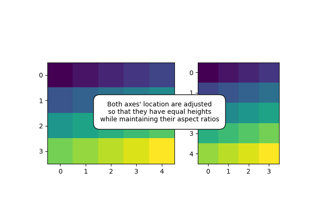
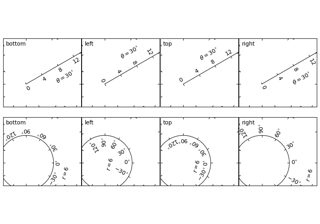
align_labels(self, axs=None)[source]¶ Align the xlabels and ylabels of subplots with the same subplots row or column (respectively) if label alignment is being done automatically (i.e. the label position is not manually set).
Alignment persists for draw events after this is called.
Parameters:
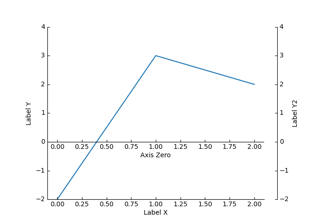
-
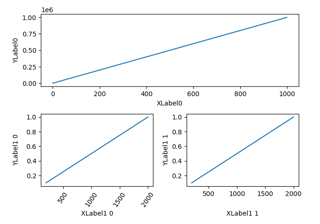
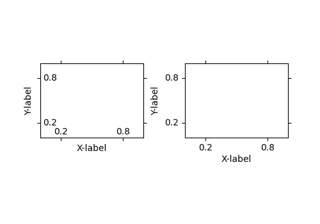
align_xlabels(self, axs=None)[source]¶ Align the ylabels of subplots in the same subplot column if label alignment is being done automatically (i.e. the label position is not manually set).
Alignment persists for draw events after this is called.
If a label is on the bottom, it is aligned with labels on axes that also have their label on the bottom and that have the same bottom-most subplot row. If the label is on the top, it is aligned with labels on axes with the same top-most row.
Parameters: Notes
This assumes that
axsare from the sameGridSpec, so that theirSubplotSpecpositions correspond to figure positions.Examples
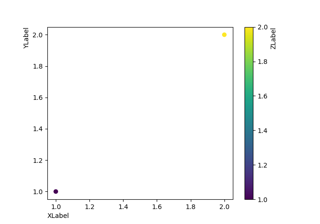
Example with rotated xtick labels:
fig, axs = plt.subplots(1, 2)
for tick in axs[0].get_xticklabels():
    tick.set_rotation(55)
axs[0].set_xlabel('XLabel 0')
axs[1].set_xlabel('XLabel 1')
fig.align_xlabels()
-
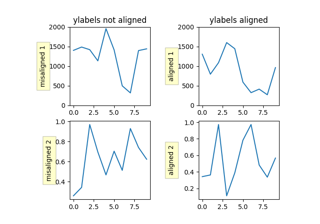
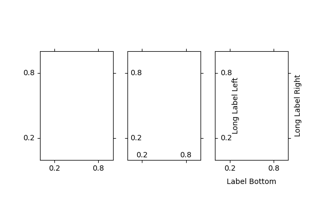
align_ylabels(self, axs=None)[source]¶ Align the ylabels of subplots in the same subplot column if label alignment is being done automatically (i.e. the label position is not manually set).
Alignment persists for draw events after this is called.
If a label is on the left, it is aligned with labels on axes that also have their label on the left and that have the same left-most subplot column. If the label is on the right, it is aligned with labels on axes with the same right-most column.
Parameters: Notes
This assumes that
axsare from the sameGridSpec, so that theirSubplotSpecpositions correspond to figure positions.Examples
Example with large yticks labels:
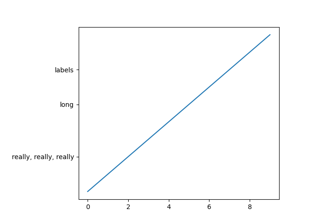
fig, axs = plt.subplots(2, 1)
axs[0].plot(np.arange(0, 1000, 50))
axs[0].set_ylabel('YLabel 0')
axs[1].set_ylabel('YLabel 1')
fig.align_ylabels()
-
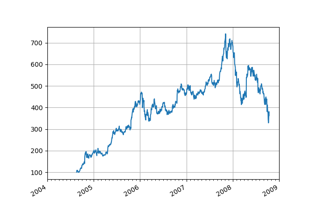
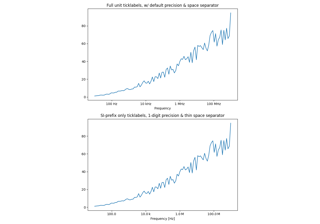
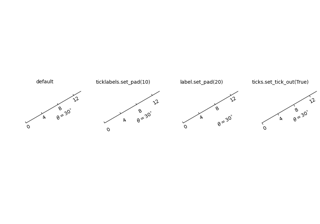
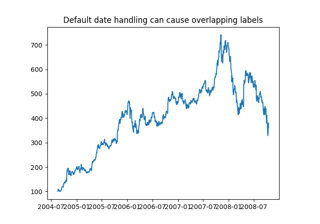
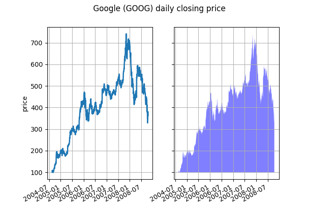
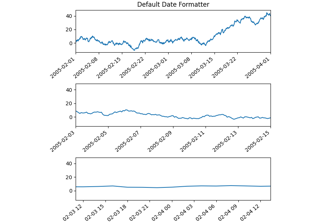
autofmt_xdate(self, bottom=0.2, rotation=30, ha='right', which='major')[source]¶ Date ticklabels often overlap, so it is useful to rotate them and right align them. Also, a common use case is a number of subplots with shared xaxes where the x-axis is date data. The ticklabels are often long, and it helps to rotate them on the bottom subplot and turn them off on other subplots, as well as turn off xlabels.
Parameters: - bottomfloat, default: 0.2
The bottom of the subplots for
subplots_adjust.- rotationfloat, default: 30 degrees
The rotation angle of the xtick labels in degrees.
- ha{'left', 'center', 'right'}, default: 'right'
The horizontal alignment of the xticklabels.
- which{'major', 'minor', 'both'}, default: 'major'
Selects which ticklabels to rotate.
-
property
axes¶ List of axes in the Figure. You can access and modify the axes in the Figure through this list.
Do not modify the list itself. Instead, use "
add_axes,add_subplotordelaxesto add or remove an axes.
-
clf(self, keep_observers=False)[source]¶ Clear the figure.
Set keep_observers to True if, for example, a gui widget is tracking the axes in the figure.
-
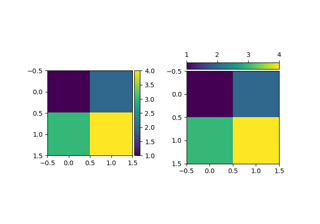
colorbar(self, mappable, cax=None, ax=None, use_gridspec=True, **kw)[source]¶ Create a colorbar for a ScalarMappable instance, mappable.
Documentation for the pyplot thin wrapper:
Add a colorbar to a plot.
Function signatures for the
pyplotinterface; all but the first are also method signatures for thecolorbarmethod:colorbar(**kwargs) colorbar(mappable, **kwargs) colorbar(mappable, cax=cax, **kwargs) colorbar(mappable, ax=ax, **kwargs)
Parameters: - mappable
The
matplotlib.cm.ScalarMappable(i.e.,AxesImage,ContourSet, etc.) described by this colorbar. This argument is mandatory for theFigure.colorbarmethod but optional for thepyplot.colorbarfunction, which sets the default to the current image.Note that one can create a
ScalarMappable"on-the-fly" to generate colorbars not attached to a previously drawn artist, e.g.fig.colorbar(cm.ScalarMappable(norm=norm, cmap=cmap), ax=ax)
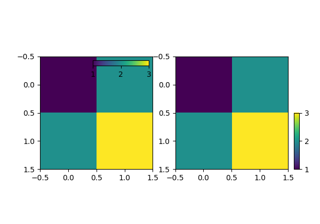
- cax
Axes, optional Axes into which the colorbar will be drawn.
- ax
Axes, list of Axes, optional Parent axes from which space for a new colorbar axes will be stolen. If a list of axes is given they will all be resized to make room for the colorbar axes.
- use_gridspecbool, optional
If cax is
None, a new cax is created as an instance of Axes. If ax is an instance of Subplot and use_gridspec isTrue, cax is created as an instance of Subplot using thegridspecmodule.
Returns: - colorbar
Colorbar See also its base class,
ColorbarBase.
Notes
Additional keyword arguments are of two kinds:
axes properties:
- fractionfloat, default: 0.15
- Fraction of original axes to use for colorbar.
- shrinkfloat, default: 1.0
- Fraction by which to multiply the size of the colorbar.
- aspectfloat, default: 20
- Ratio of long to short dimensions.
- padfloat, default: 0.05 if vertical, 0.15 if horizontal
- Fraction of original axes between colorbar and new image axes.
- anchor(float, float), optional
- The anchor point of the colorbar axes. Defaults to (0.0, 0.5) if vertical; (0.5, 1.0) if horizontal.
- panchor(float, float), or False, optional
- The anchor point of the colorbar parent axes. If False, the parent axes' anchor will be unchanged. Defaults to (1.0, 0.5) if vertical; (0.5, 0.0) if horizontal.
colorbar properties:
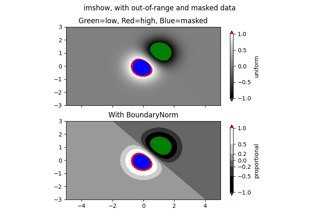
Property Description extend {'neither', 'both', 'min', 'max'} If not 'neither', make pointed end(s) for out-of- range values. These are set for a given colormap using the colormap set_under and set_over methods. extendfrac {None, 'auto', length, lengths} If set to None, both the minimum and maximum triangular colorbar extensions with have a length of 5% of the interior colorbar length (this is the default setting). If set to 'auto', makes the triangular colorbar extensions the same lengths as the interior boxes (when spacing is set to 'uniform') or the same lengths as the respective adjacent interior boxes (when spacing is set to 'proportional'). If a scalar, indicates the length of both the minimum and maximum triangular colorbar extensions as a fraction of the interior colorbar length. A two-element sequence of fractions may also be given, indicating the lengths of the minimum and maximum colorbar extensions respectively as a fraction of the interior colorbar length. extendrect bool If False the minimum and maximum colorbar extensions will be triangular (the default). If True the extensions will be rectangular. spacing {'uniform', 'proportional'} Uniform spacing gives each discrete color the same space; proportional makes the space proportional to the data interval. ticks None or list of ticks or Locator If None, ticks are determined automatically from the input. format None or str or Formatter If None, ScalarFormatteris used. If a format string is given, e.g., '%.3f', that is used. An alternativeFormattermay be given instead.drawedges bool Whether to draw lines at color boundaries. label str The label on the colorbar's long axis. The following will probably be useful only in the context of indexed colors (that is, when the mappable has norm=NoNorm()), or other unusual circumstances.
Property Description boundaries None or a sequence values None or a sequence which must be of length 1 less than the sequence of boundaries. For each region delimited by adjacent entries in boundaries, the color mapped to the corresponding value in values will be used. If mappable is a
ContourSet, its extend kwarg is included automatically.The shrink kwarg provides a simple way to scale the colorbar with respect to the axes. Note that if cax is specified, it determines the size of the colorbar and shrink and aspect kwargs are ignored.
For more precise control, you can manually specify the positions of the axes objects in which the mappable and the colorbar are drawn. In this case, do not use any of the axes properties kwargs.
It is known that some vector graphics viewers (svg and pdf) renders white gaps between segments of the colorbar. This is due to bugs in the viewers, not Matplotlib. As a workaround, the colorbar can be rendered with overlapping segments:
cbar = colorbar()
cbar.solids.set_edgecolor("face")
draw()
However this has negative consequences in other circumstances, e.g. with semi-transparent images (alpha < 1) and colorbar extensions; therefore, this workaround is not used by default (see issue #1188).
-
contains(self, mouseevent)[source]¶ Test whether the mouse event occurred on the figure.
Returns: - bool, {}
-
property
dpi¶ The resolution in dots per inch.
-
draw(self, renderer)[source]¶ Draw the Artist (and its children) using the given renderer.
This has no effect if the artist is not visible (
Artist.get_visiblereturns False).Parameters: - renderer
RendererBasesubclass.
Notes
This method is overridden in the Artist subclasses.
- renderer
-
draw_artist(self, a)[source]¶ Draw
Artistinstance a only.This can only be called after the figure has been drawn.
-
execute_constrained_layout(self, renderer=None)[source]¶ Use
layoutboxto determine pos positions within axes.See also
set_constrained_layout_pads.
-
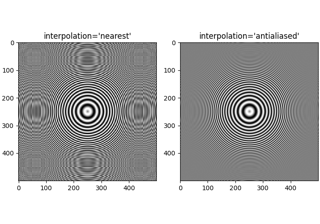
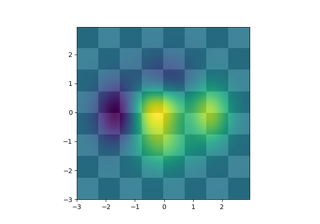
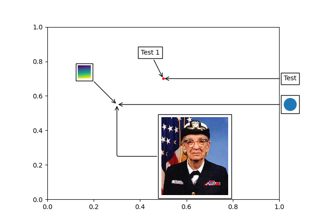
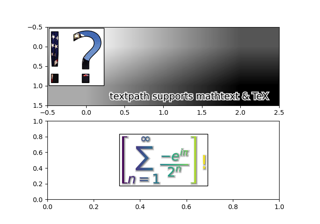
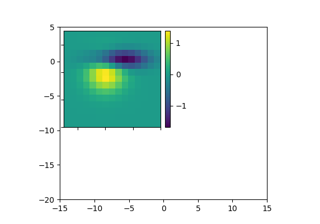
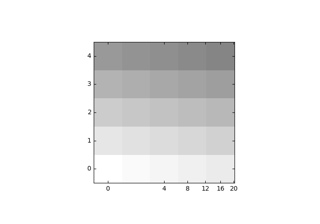
figimage(self, X, xo=0, yo=0, alpha=None, norm=None, cmap=None, vmin=None, vmax=None, origin=None, resize=False, **kwargs)[source]¶ Add a non-resampled image to the figure.
The image is attached to the lower or upper left corner depending on origin.
Parameters: - X
The image data. This is an array of one of the following shapes:
- MxN: luminance (grayscale) values
- MxNx3: RGB values
- MxNx4: RGBA values
- xo, yoint
The x/y image offset in pixels.
- alphaNone or float
The alpha blending value.
- norm
matplotlib.colors.Normalize A
Normalizeinstance to map the luminance to the interval [0, 1].- cmapstr or
matplotlib.colors.Colormap, default:rcParams["image.cmap"](default:'viridis') The colormap to use.
- vmin, vmaxfloat
If norm is not given, these values set the data limits for the colormap.
- origin{'upper', 'lower'}, default:
rcParams["image.origin"](default:'upper') Indicates where the [0, 0] index of the array is in the upper left or lower left corner of the axes.
- resizebool
If True, resize the figure to match the given image size.
Returns: Other Parameters: - **kwargs
Additional kwargs are
Artistkwargs passed on toFigureImage.
Notes
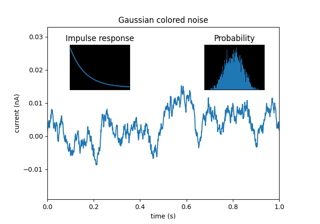
figimage complements the axes image (
imshow) which will be resampled to fit the current axes. If you want a resampled image to fill the entire figure, you can define anAxeswith extent [0, 0, 1, 1].Examples
f = plt.figure()
nx = int(f.get_figwidth() * f.dpi)
ny = int(f.get_figheight() * f.dpi)
data = np.random.random((ny, nx))
f.figimage(data)
plt.show()
-
property
frameon¶ Return the figure's background patch visibility, i.e. whether the figure background will be drawn. Equivalent to
Figure.patch.get_visible().
-
gca(self, **kwargs)[source]¶ Get the current axes, creating one if necessary.
The following kwargs are supported for ensuring the returned axes adheres to the given projection etc., and for axes creation if the active axes does not exist:
Property Description adjustable{'box', 'datalim'} agg_filtera filter function, which takes a (m, n, 3) float array and a dpi value, and returns a (m, n, 3) array alphafloat or None anchor2-tuple of floats or {'C', 'SW', 'S', 'SE', ...} animatedbool aspect{'auto'} or num autoscale_onbool autoscalex_onbool autoscaley_onbool axes_locatorCallable[[Axes, Renderer], Bbox] axisbelowbool or 'line' box_aspectNone, or a number clip_boxBboxclip_onbool clip_pathPatch or (Path, Transform) or None containsunknown facecoloror fccolor figureFigureframe_onbool gidstr in_layoutbool labelobject navigatebool navigate_modeunknown path_effectsAbstractPathEffectpickerNone or bool or callable position[left, bottom, width, height] or Bboxprop_cycleunknown rasterization_zorderfloat or None rasterizedbool or None sketch_params(scale: float, length: float, randomness: float) snapbool or None titlestr transformTransformurlstr visiblebool xboundunknown xlabelstr xlim(bottom: float, top: float) xmarginfloat greater than -0.5 xscale{"linear", "log", "symlog", "logit", ...} xticklabelsunknown xticksunknown yboundunknown ylabelstr ylim(bottom: float, top: float) ymarginfloat greater than -0.5 yscale{"linear", "log", "symlog", "logit", ...} yticklabelsunknown yticksunknown zorderfloat
-
get_axes(self)[source]¶ Return a list of axes in the Figure. You can access and modify the axes in the Figure through this list.
Do not modify the list itself. Instead, use
add_axes,add_subplotordelaxesto add or remove an axes.Note: This is equivalent to the property
axes.
-
get_constrained_layout_pads(self, relative=False)[source]¶ Get padding for
constrained_layout.Returns a list of
w_pad, h_padin inches andwspaceandhspaceas fractions of the subplot.Parameters: - relativebool
If
True, then convert from inches to figure relative.
-
get_frameon(self)[source]¶ Return the figure's background patch visibility, i.e. whether the figure background will be drawn. Equivalent to
Figure.patch.get_visible().
-
get_size_inches(self)[source]¶ Return the current size of the figure in inches.
Returns: - ndarray
The size (width, height) of the figure in inches.
See also
Notes
The size in pixels can be obtained by multiplying with
Figure.dpi.
-
get_tight_layout(self)[source]¶ Return whether
tight_layoutis called when drawing.
-
get_tightbbox(self, renderer, bbox_extra_artists=None)[source]¶ Return a (tight) bounding box of the figure in inches.
Artists that have
artist.set_in_layout(False)are not included in the bbox.Parameters: - renderer
RendererBasesubclass renderer that will be used to draw the figures (i.e.
fig.canvas.get_renderer())- bbox_extra_artistslist of
ArtistorNone List of artists to include in the tight bounding box. If
None(default), then all artist children of each axes are included in the tight bounding box.
Returns: BboxBasecontaining the bounding box (in figure inches).
- renderer
-
get_window_extent(self, *args, **kwargs)[source]¶ Return the figure bounding box in display space. Arguments are ignored.
-
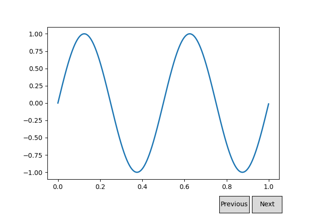
ginput(self, n=1, timeout=30, show_clicks=True, mouse_add=<MouseButton.LEFT: 1>, mouse_pop=<MouseButton.RIGHT: 3>, mouse_stop=<MouseButton.MIDDLE: 2>)[source]¶ Blocking call to interact with a figure.
Wait until the user clicks n times on the figure, and return the coordinates of each click in a list.
There are three possible interactions:
- Add a point.
- Remove the most recently added point.
- Stop the interaction and return the points added so far.
The actions are assigned to mouse buttons via the arguments mouse_add, mouse_pop and mouse_stop.
Parameters: - nint, default: 1
Number of mouse clicks to accumulate. If negative, accumulate clicks until the input is terminated manually.
- timeoutfloat, default: 30 seconds
Number of seconds to wait before timing out. If zero or negative will never timeout.
- show_clicksbool, default: True
If True, show a red cross at the location of each click.
- mouse_add
MouseButtonor None, default:MouseButton.LEFT Mouse button used to add points.
- mouse_pop
MouseButtonor None, default:MouseButton.RIGHT Mouse button used to remove the most recently added point.
- mouse_stop
MouseButtonor None, default:MouseButton.MIDDLE Mouse button used to stop input.
Returns: - list of tuples
A list of the clicked (x, y) coordinates.
Notes
The keyboard can also be used to select points in case your mouse does not have one or more of the buttons. The delete and backspace keys act like right clicking (i.e., remove last point), the enter key terminates input and any other key (not already used by the window manager) selects a point.
-
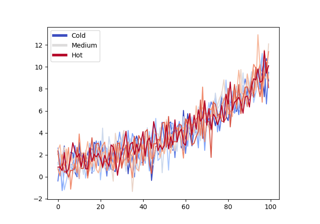
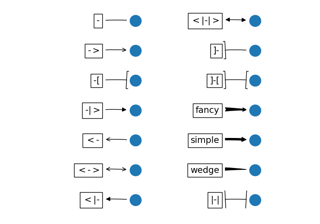
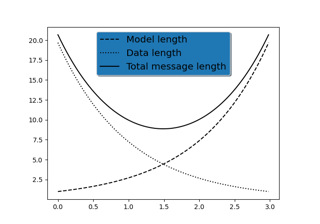
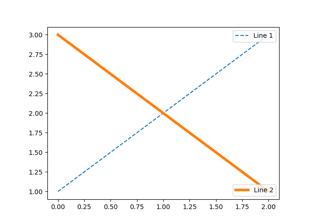
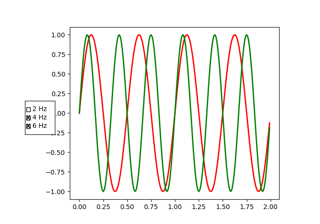
legend(self, *args, **kwargs)[source]¶ Place a legend on the figure.
To make a legend from existing artists on every axes:
legend()
To make a legend for a list of lines and labels:
legend(
    (line1, line2, line3),
    ('label1', 'label2', 'label3'),
    loc='upper right')
These can also be specified by keyword:
legend(
    handles=(line1, line2, line3),
    labels=('label1', 'label2', 'label3'),
    loc='upper right')
Parameters: - handleslist of
Artist, optional A list of Artists (lines, patches) to be added to the legend. Use this together with labels, if you need full control on what is shown in the legend and the automatic mechanism described above is not sufficient.
The length of handles and labels should be the same in this case. If they are not, they are truncated to the smaller length.
- labelslist of str, optional
A list of labels to show next to the artists. Use this together with handles, if you need full control on what is shown in the legend and the automatic mechanism described above is not sufficient.
Returns: Other Parameters: - locstr or pair of floats, default:
rcParams["legend.loc"](default:'best') ('best' for axes, 'upper right' for figures) The location of the legend.
The strings
'upper left', 'upper right', 'lower left', 'lower right'place the legend at the corresponding corner of the axes/figure.The strings
'upper center', 'lower center', 'center left', 'center right'place the legend at the center of the corresponding edge of the axes/figure.The string
'center'places the legend at the center of the axes/figure.The string
'best'places the legend at the location, among the nine locations defined so far, with the minimum overlap with other drawn artists. This option can be quite slow for plots with large amounts of data; your plotting speed may benefit from providing a specific location.The location can also be a 2-tuple giving the coordinates of the lower-left corner of the legend in axes coordinates (in which case bbox_to_anchor will be ignored).
For back-compatibility,
'center right'(but no other location) can also be spelled'right', and each "string" locations can also be given as a numeric value:Location String Location Code 'best' 0 'upper right' 1 'upper left' 2 'lower left' 3 'lower right' 4 'right' 5 'center left' 6 'center right' 7 'lower center' 8 'upper center' 9 'center' 10 - bbox_to_anchor
BboxBase, 2-tuple, or 4-tuple of floats Box that is used to position the legend in conjunction with loc. Defaults to
axes.bbox(if called as a method toAxes.legend) orfigure.bbox(ifFigure.legend). This argument allows arbitrary placement of the legend.Bbox coordinates are interpreted in the coordinate system given by bbox_transform, with the default transform Axes or Figure coordinates, depending on which
legendis called.If a 4-tuple or
BboxBaseis given, then it specifies the bbox(x, y, width, height)that the legend is placed in. To put the legend in the best location in the bottom right quadrant of the axes (or figure):loc='best', bbox_to_anchor=(0.5, 0., 0.5, 0.5)
A 2-tuple
(x, y)places the corner of the legend specified by loc at x, y. For example, to put the legend's upper right-hand corner in the center of the axes (or figure) the following keywords can be used:loc='upper right', bbox_to_anchor=(0.5, 0.5)
- ncolint, default: 1
The number of columns that the legend has.
- propNone or
matplotlib.font_manager.FontPropertiesor dict The font properties of the legend. If None (default), the current
matplotlib.rcParamswill be used.- fontsizeint or {'xx-small', 'x-small', 'small', 'medium', 'large', 'x-large', 'xx-large'}
The font size of the legend. If the value is numeric the size will be the absolute font size in points. String values are relative to the current default font size. This argument is only used if prop is not specified.
- labelcolorstr or list
Sets the color of the text in the legend. Can be a valid color string (for example, 'red'), or a list of color strings. The labelcolor can also be made to match the color of the line or marker using 'linecolor', 'markerfacecolor' (or 'mfc'), or 'markeredgecolor' (or 'mec').
- numpointsint, default:
rcParams["legend.numpoints"](default:1) The number of marker points in the legend when creating a legend entry for a
Line2D(line).- scatterpointsint, default:
rcParams["legend.scatterpoints"](default:1) The number of marker points in the legend when creating a legend entry for a
PathCollection(scatter plot).- scatteryoffsetsiterable of floats, default:
[0.375, 0.5, 0.3125] The vertical offset (relative to the font size) for the markers created for a scatter plot legend entry. 0.0 is at the base the legend text, and 1.0 is at the top. To draw all markers at the same height, set to
[0.5].- markerscalefloat, default:
rcParams["legend.markerscale"](default:1.0) The relative size of legend markers compared with the originally drawn ones.
- markerfirstbool, default: True
If True, legend marker is placed to the left of the legend label. If False, legend marker is placed to the right of the legend label.
- frameonbool, default:
rcParams["legend.frameon"](default:True) Whether the legend should be drawn on a patch (frame).
- fancyboxbool, default:
rcParams["legend.fancybox"](default:True) Whether round edges should be enabled around the
FancyBboxPatchwhich makes up the legend's background.- shadowbool, default:
rcParams["legend.shadow"](default:False) Whether to draw a shadow behind the legend.
- framealphafloat, default:
rcParams["legend.framealpha"](default:0.8) The alpha transparency of the legend's background. If shadow is activated and framealpha is
None, the default value is ignored.- facecolor"inherit" or color, default:
rcParams["legend.facecolor"](default:'inherit') The legend's background color. If
"inherit", usercParams["axes.facecolor"](default:'white').- edgecolor"inherit" or color, default:
rcParams["legend.edgecolor"](default:'0.8') The legend's background patch edge color. If
"inherit", use takercParams["axes.edgecolor"](default:'black').- mode{"expand", None}
If mode is set to
"expand"the legend will be horizontally expanded to fill the axes area (or bbox_to_anchor if defines the legend's size).- bbox_transformNone or
matplotlib.transforms.Transform The transform for the bounding box (bbox_to_anchor). For a value of
None(default) the Axes'transAxestransform will be used.- titlestr or None
The legend's title. Default is no title (
None).- title_fontsizeint or {'xx-small', 'x-small', 'small', 'medium', 'large', 'x-large', 'xx-large'}, default:
rcParams["legend.title_fontsize"](default:None) The font size of the legend's title.
- borderpadfloat, default:
rcParams["legend.borderpad"](default:0.4) The fractional whitespace inside the legend border, in font-size units.
- labelspacingfloat, default:
rcParams["legend.labelspacing"](default:0.5) The vertical space between the legend entries, in font-size units.
- handlelengthfloat, default:
rcParams["legend.handlelength"](default:2.0) The length of the legend handles, in font-size units.
- handletextpadfloat, default:
rcParams["legend.handletextpad"](default:0.8) The pad between the legend handle and text, in font-size units.
- borderaxespadfloat, default:
rcParams["legend.borderaxespad"](default:0.5) The pad between the axes and legend border, in font-size units.
- columnspacingfloat, default:
rcParams["legend.columnspacing"](default:2.0) The spacing between columns, in font-size units.
- handler_mapdict or None
The custom dictionary mapping instances or types to a legend handler. This handler_map updates the default handler map found at
matplotlib.legend.Legend.get_legend_handler_map.
Notes
Some artists are not supported by this function. See Legend guide for details.
- handleslist of
-
savefig(self, fname, *, transparent=None, **kwargs)[source]¶ Save the current figure.
Call signature:
savefig(fname, dpi=None, facecolor='w', edgecolor='w',
        orientation='portrait', papertype=None, format=None,
        transparent=False, bbox_inches=None, pad_inches=0.1,
        frameon=None, metadata=None)
The available output formats depend on the backend being used.
Parameters: - fnamestr or path-like or file-like
A path, or a Python file-like object, or possibly some backend-dependent object such as
matplotlib.backends.backend_pdf.PdfPages.If format is set, it determines the output format, and the file is saved as fname. Note that fname is used verbatim, and there is no attempt to make the extension, if any, of fname match format, and no extension is appended.
If format is not set, then the format is inferred from the extension of fname, if there is one. If format is not set and fname has no extension, then the file is saved with
rcParams["savefig.format"](default:'png') and the appropriate extension is appended to fname.
Other Parameters: - dpifloat or 'figure', default:
rcParams["savefig.dpi"](default:'figure') The resolution in dots per inch. If 'figure', use the figure's dpi value.
- qualityint, default:
rcParams["savefig.jpeg_quality"](default:95) Applicable only if format is 'jpg' or 'jpeg', ignored otherwise.
The image quality, on a scale from 1 (worst) to 95 (best). Values above 95 should be avoided; 100 disables portions of the JPEG compression algorithm, and results in large files with hardly any gain in image quality.
This parameter is deprecated.
- optimizebool, default: False
Applicable only if format is 'jpg' or 'jpeg', ignored otherwise.
Whether the encoder should make an extra pass over the image in order to select optimal encoder settings.
This parameter is deprecated.
- progressivebool, default: False
Applicable only if format is 'jpg' or 'jpeg', ignored otherwise.
Whether the image should be stored as a progressive JPEG file.
This parameter is deprecated.
- facecolorcolor or 'auto', default:
rcParams["savefig.facecolor"](default:'auto') The facecolor of the figure. If 'auto', use the current figure facecolor.
- edgecolorcolor or 'auto', default:
rcParams["savefig.edgecolor"](default:'auto') The edgecolor of the figure. If 'auto', use the current figure edgecolor.
- orientation{'landscape', 'portrait'}
Currently only supported by the postscript backend.
- papertypestr
One of 'letter', 'legal', 'executive', 'ledger', 'a0' through 'a10', 'b0' through 'b10'. Only supported for postscript output.
- formatstr
The file format, e.g. 'png', 'pdf', 'svg', ... The behavior when this is unset is documented under fname.
- transparentbool
If True, the axes patches will all be transparent; the figure patch will also be transparent unless facecolor and/or edgecolor are specified via kwargs. This is useful, for example, for displaying a plot on top of a colored background on a web page. The transparency of these patches will be restored to their original values upon exit of this function.
- bbox_inchesstr or
Bbox, default:rcParams["savefig.bbox"](default:None) Bounding box in inches: only the given portion of the figure is saved. If 'tight', try to figure out the tight bbox of the figure.
- pad_inchesfloat, default:
rcParams["savefig.pad_inches"](default:0.1) Amount of padding around the figure when bbox_inches is 'tight'.
- bbox_extra_artistslist of
Artist, optional A list of extra artists that will be considered when the tight bbox is calculated.
- backendstr, optional
Use a non-default backend to render the file, e.g. to render a png file with the "cairo" backend rather than the default "agg", or a pdf file with the "pgf" backend rather than the default "pdf". Note that the default backend is normally sufficient. See The builtin backends for a list of valid backends for each file format. Custom backends can be referenced as "module://...".
- metadatadict, optional
Key/value pairs to store in the image metadata. The supported keys and defaults depend on the image format and backend:
- pil_kwargsdict, optional
Additional keyword arguments that are passed to
PIL.Image.Image.savewhen saving the figure.
-
set_canvas(self, canvas)[source]¶ Set the canvas that contains the figure
Parameters: - canvasFigureCanvas
-
set_constrained_layout(self, constrained)[source]¶ Set whether
constrained_layoutis used upon drawing. If None,rcParams["figure.constrained_layout.use"](default:False) value will be used.When providing a dict containing the keys
w_pad,h_padthe defaultconstrained_layoutpaddings will be overridden. These pads are in inches and default to 3.0/72.0.w_padis the width padding andh_padis the height padding.Parameters: - constrainedbool or dict or None
-
set_constrained_layout_pads(self, **kwargs)[source]¶ Set padding for
constrained_layout. Note the kwargs can be passed as a dictionaryfig.set_constrained_layout(**paddict).Parameters: - w_padfloat
Width padding in inches. This is the pad around axes and is meant to make sure there is enough room for fonts to look good. Defaults to 3 pts = 0.04167 inches
- h_padfloat
Height padding in inches. Defaults to 3 pts.
- wspacefloat
Width padding between subplots, expressed as a fraction of the subplot width. The total padding ends up being w_pad + wspace.
- hspacefloat
Height padding between subplots, expressed as a fraction of the subplot width. The total padding ends up being h_pad + hspace.
-
set_edgecolor(self, color)[source]¶ Set the edge color of the Figure rectangle.
Parameters: - colorcolor
-
set_facecolor(self, color)[source]¶ Set the face color of the Figure rectangle.
Parameters: - colorcolor
-
set_figheight(self, val, forward=True)[source]¶ Set the height of the figure in inches.
Parameters: - valfloat
- forwardbool
See
set_size_inches.
-
set_figwidth(self, val, forward=True)[source]¶ Set the width of the figure in inches.
Parameters: - valfloat
- forwardbool
See
set_size_inches.
-
set_frameon(self, b)[source]¶ Set the figure's background patch visibility, i.e. whether the figure background will be drawn. Equivalent to
Figure.patch.set_visible().Parameters: - bbool
-
set_size_inches(self, w, h=None, forward=True)[source]¶ Set the figure size in inches.
Call signatures:
fig.set_size_inches(w, h)  # OR
fig.set_size_inches((w, h))
Parameters: - w(float, float) or float
Width and height in inches (if height not specified as a separate argument) or width.
- hfloat
Height in inches.
- forwardbool, default: True
If
True, the canvas size is automatically updated, e.g., you can resize the figure window from the shell.
See also
Notes
To transform from pixels to inches divide by
Figure.dpi.
-
set_tight_layout(self, tight)[source]¶ Set whether and how
tight_layoutis called when drawing.Parameters: - tightbool or dict with keys "pad", "w_pad", "h_pad", "rect" or None
If a bool, sets whether to call
tight_layoutupon drawing. IfNone, use thefigure.autolayoutrcparam instead. If a dict, pass it as kwargs totight_layout, overriding the default paddings.
-
show(self, warn=True)[source]¶ If using a GUI backend with pyplot, display the figure window.
If the figure was not created using
figure, it will lack aFigureManagerBase, and this method will raise an AttributeError.Warning
This does not manage an GUI event loop. Consequently, the figure may only be shown briefly or not shown at all if you or your environment are not managing an event loop.
Proper use cases for
Figure.showinclude running this from a GUI application or an IPython shell.If you're running a pure python shell or executing a non-GUI python script, you should use
matplotlib.pyplot.showinstead, which takes care of managing the event loop for you.Parameters: - warnbool, default: True
If
Trueand we are not running headless (i.e. on Linux with an unset DISPLAY), issue warning when called on a non-GUI backend.
-
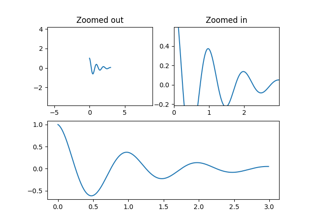
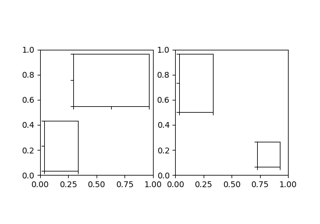
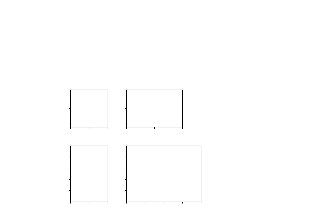
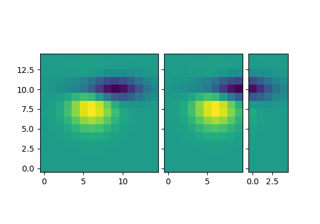
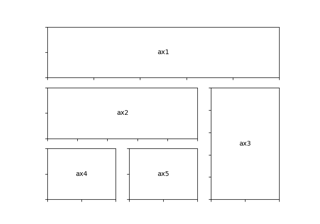
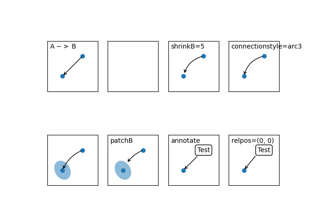
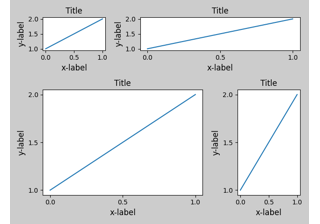
subplot_mosaic(self, layout, *, subplot_kw=None, gridspec_kw=None, empty_sentinel='.')[source]¶ Build a layout of Axes based on ASCII art or nested lists.
This is a helper function to build complex GridSpec layouts visually.
Note
This API is provisional and may be revised in the future based on early user feedback.
Parameters: - layoutlist of list of {hashable or nested} or str
A visual layout of how you want your Axes to be arranged labeled as strings. For example
x = [['A panel', 'A panel', 'edge'],
     ['C panel', '.',       'edge']]
Produces 4 axes:
- 'A panel' which is 1 row high and spans the first two columns
- 'edge' which is 2 rows high and is on the right edge
- 'C panel' which in 1 row and 1 column wide in the bottom left
- a blank space 1 row and 1 column wide in the bottom center
Any of the entries in the layout can be a list of lists of the same form to create nested layouts.
If input is a str, then it must be of the form
'''
AAE
C.E
'''
where each character is a column and each line is a row. This only allows only single character Axes labels and does not allow nesting but is very terse.
- subplot_kwdict, optional
Dictionary with keywords passed to the
Figure.add_subplotcall used to create each subplot.- gridspec_kwdict, optional
Dictionary with keywords passed to the
GridSpecconstructor used to create the grid the subplots are placed on.- empty_sentinelobject, optional
Entry in the layout to mean "leave this space empty". Defaults to
'.'. Note, if layout is a string, it is processed viainspect.cleandocto remove leading white space, which may interfere with using white-space as the empty sentinel.
Returns: - dict[label, Axes]
A dictionary mapping the labels to the Axes objects.
-
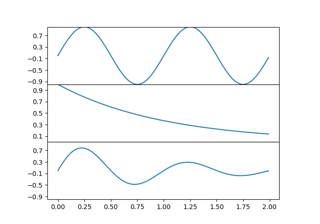
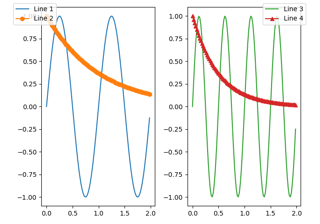
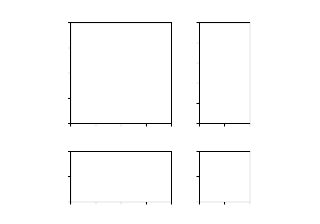
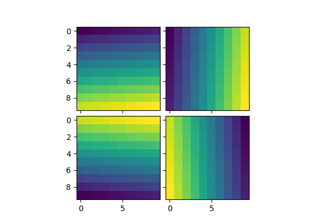
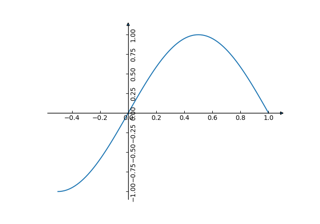
subplots(self, nrows=1, ncols=1, *, sharex=False, sharey=False, squeeze=True, subplot_kw=None, gridspec_kw=None)[source]¶ Add a set of subplots to this figure.
This utility wrapper makes it convenient to create common layouts of subplots in a single call.
Parameters: - nrows, ncolsint, default: 1
Number of rows/columns of the subplot grid.
- sharex, shareybool or {'none', 'all', 'row', 'col'}, default: False
Controls sharing of properties among x (sharex) or y (sharey) axes:
- True or 'all': x- or y-axis will be shared among all subplots.
- False or 'none': each subplot x- or y-axis will be independent.
- 'row': each subplot row will share an x- or y-axis.
- 'col': each subplot column will share an x- or y-axis.
When subplots have a shared x-axis along a column, only the x tick labels of the bottom subplot are created. Similarly, when subplots have a shared y-axis along a row, only the y tick labels of the first column subplot are created. To later turn other subplots' ticklabels on, use
tick_params.- squeezebool, default: True
- If True, extra dimensions are squeezed out from the returned
array of Axes:
- if only one subplot is constructed (nrows=ncols=1), the resulting single Axes object is returned as a scalar.
- for Nx1 or 1xM subplots, the returned object is a 1D numpy object array of Axes objects.
- for NxM, subplots with N>1 and M>1 are returned as a 2D array.
- If False, no squeezing at all is done: the returned Axes object is always a 2D array containing Axes instances, even if it ends up being 1x1.
- If True, extra dimensions are squeezed out from the returned
array of Axes:
- subplot_kwdict, optional
Dict with keywords passed to the
Figure.add_subplotcall used to create each subplot.- gridspec_kwdict, optional
Dict with keywords passed to the
GridSpecconstructor used to create the grid the subplots are placed on.
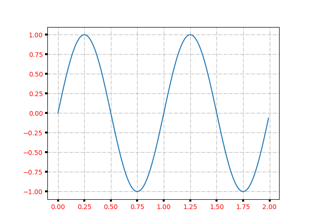
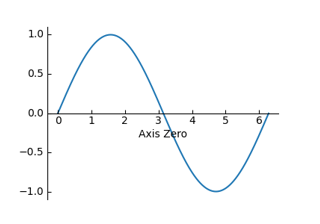
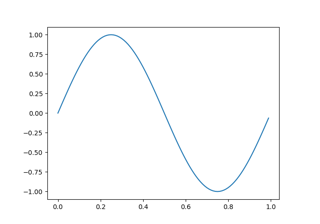
Returns: Examples
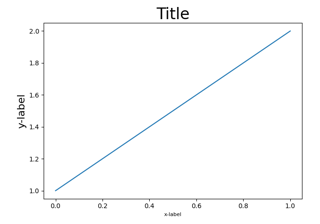
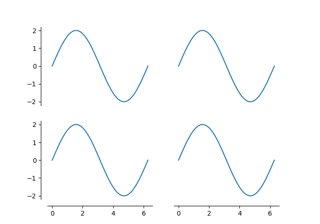
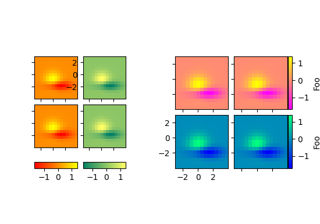
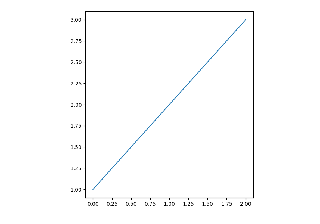
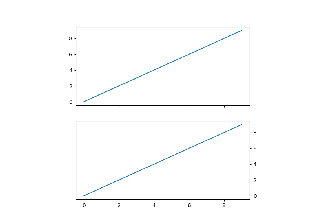
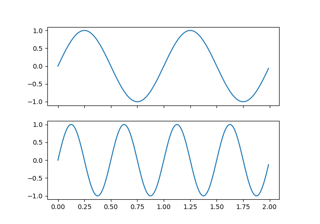
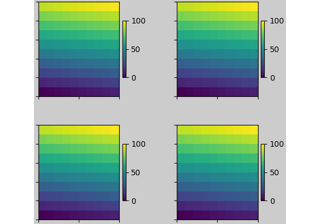
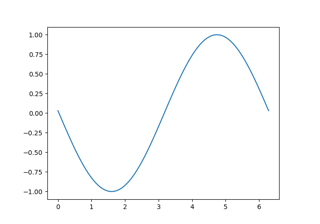
# First create some toy data:
x = np.linspace(0, 2*np.pi, 400)
y = np.sin(x**2)

# Create a figure
plt.figure()

# Create a subplot
ax = fig.subplots()
ax.plot(x, y)
ax.set_title('Simple plot')

# Create two subplots and unpack the output array immediately
ax1, ax2 = fig.subplots(1, 2, sharey=True)
ax1.plot(x, y)
ax1.set_title('Sharing Y axis')
ax2.scatter(x, y)

# Create four polar axes and access them through the returned array
axes = fig.subplots(2, 2, subplot_kw=dict(polar=True))
axes[0, 0].plot(x, y)
axes[1, 1].scatter(x, y)

# Share a X axis with each column of subplots
fig.subplots(2, 2, sharex='col')

# Share a Y axis with each row of subplots
fig.subplots(2, 2, sharey='row')

# Share both X and Y axes with all subplots
fig.subplots(2, 2, sharex='all', sharey='all')

# Note that this is the same as
fig.subplots(2, 2, sharex=True, sharey=True)
-
subplots_adjust(self, left=None, bottom=None, right=None, top=None, wspace=None, hspace=None)[source]¶ Adjust the subplot layout parameters.
Unset parameters are left unmodified; initial values are given by
rcParams["figure.subplot.[name]"].Parameters: - leftfloat, optional
The position of the left edge of the subplots, as a fraction of the figure width.
- rightfloat, optional
The position of the right edge of the subplots, as a fraction of the figure width.
- bottomfloat, optional
The position of the bottom edge of the subplots, as a fraction of the figure height.
- topfloat, optional
The position of the top edge of the subplots, as a fraction of the figure height.
- wspacefloat, optional
The width of the padding between subplots, as a fraction of the average axes width.
- hspacefloat, optional
The height of the padding between subplots, as a fraction of the average axes height.
-
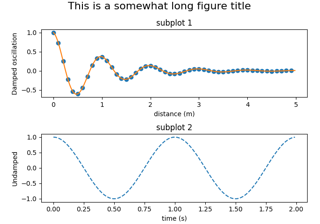
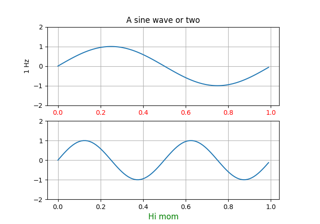
suptitle(self, t, **kwargs)[source]¶ Add a centered title to the figure.
Parameters: - tstr
The title text.
- xfloat, default 0.5
The x location of the text in figure coordinates.
- yfloat, default 0.98
The y location of the text in figure coordinates.
- horizontalalignment, ha{'center', 'left', right'}, default: 'center'
The horizontal alignment of the text relative to (x, y).
- verticalalignment, va{'top', 'center', 'bottom', 'baseline'}, default: 'top'
The vertical alignment of the text relative to (x, y).
- fontsize, sizedefault:
rcParams["figure.titlesize"](default:'large') The font size of the text. See
Text.set_sizefor possible values.- fontweight, weightdefault:
rcParams["figure.titleweight"](default:'normal') The font weight of the text. See
Text.set_weightfor possible values.
Returns: - text
The
Textinstance of the title.
Other Parameters: - fontpropertiesNone or dict, optional
A dict of font properties. If fontproperties is given the default values for font size and weight are taken from the
FontPropertiesdefaults.rcParams["figure.titlesize"](default:'large') andrcParams["figure.titleweight"](default:'normal') are ignored in this case.- **kwargs
Additional kwargs are
matplotlib.text.Textproperties.
Examples
>>> fig.suptitle('This is the figure title', fontsize=12)
-
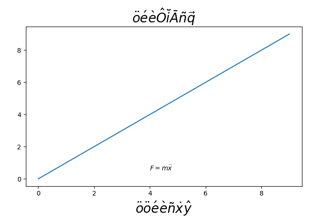
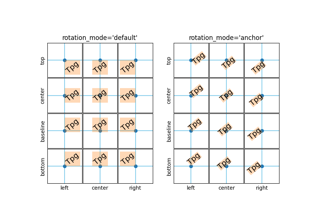
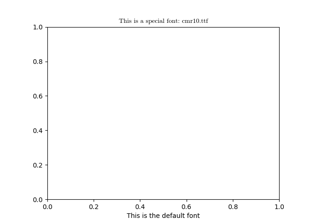
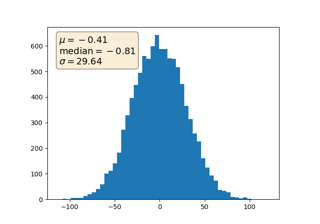
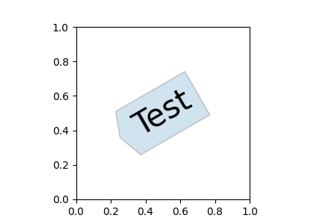
text(self, x, y, s, fontdict=None, **kwargs)[source]¶ Add text to figure.
Parameters: - x, yfloat
The position to place the text. By default, this is in figure coordinates, floats in [0, 1]. The coordinate system can be changed using the transform keyword.
- sstr
The text string.
- fontdictdict, optional
A dictionary to override the default text properties. If not given, the defaults are determined by
rcParams["font.*"]. Properties passed as kwargs override the corresponding ones given in fontdict.
Returns: Other Parameters: - **kwargs
Textproperties Other miscellaneous text parameters.
Property Description agg_filtera filter function, which takes a (m, n, 3) float array and a dpi value, and returns a (m, n, 3) array alphafloat or None animatedbool backgroundcolorcolor bboxdict with properties for patches.FancyBboxPatchclip_boxBboxclip_onbool clip_pathPatch or (Path, Transform) or None coloror ccolor containsunknown figureFigurefontfamilyor family{FONTNAME, 'serif', 'sans-serif', 'cursive', 'fantasy', 'monospace'} fontpropertiesor font or font_propertiesfont_manager.FontPropertiesorstrorpathlib.Pathfontsizeor sizefloat or {'xx-small', 'x-small', 'small', 'medium', 'large', 'x-large', 'xx-large'} fontstretchor stretch{a numeric value in range 0-1000, 'ultra-condensed', 'extra-condensed', 'condensed', 'semi-condensed', 'normal', 'semi-expanded', 'expanded', 'extra-expanded', 'ultra-expanded'} fontstyleor style{'normal', 'italic', 'oblique'} fontvariantor variant{'normal', 'small-caps'} fontweightor weight{a numeric value in range 0-1000, 'ultralight', 'light', 'normal', 'regular', 'book', 'medium', 'roman', 'semibold', 'demibold', 'demi', 'bold', 'heavy', 'extra bold', 'black'} gidstr horizontalalignmentor ha{'center', 'right', 'left'} in_layoutbool labelobject linespacingfloat (multiple of font size) multialignmentor ma{'left', 'right', 'center'} path_effectsAbstractPathEffectpickerNone or bool or callable position(float, float) rasterizedbool or None rotationfloat or {'vertical', 'horizontal'} rotation_mode{None, 'default', 'anchor'} sketch_params(scale: float, length: float, randomness: float) snapbool or None textobject transformTransformurlstr usetexbool or None verticalalignmentor va{'center', 'top', 'bottom', 'baseline', 'center_baseline'} visiblebool wrapbool xfloat yfloat zorderfloat
See also
-
tight_layout(self, renderer=<deprecated parameter>, pad=1.08, h_pad=None, w_pad=None, rect=None)[source]¶ Adjust the padding between and around subplots.
To exclude an artist on the axes from the bounding box calculation that determines the subplot parameters (i.e. legend, or annotation), set
a.set_in_layout(False)for that artist.Parameters: - renderersubclass of
RendererBase, optional Defaults to the renderer for the figure. Deprecated.
- padfloat, default: 1.08
Padding between the figure edge and the edges of subplots, as a fraction of the font size.
- h_pad, w_padfloat, default: pad
Padding (height/width) between edges of adjacent subplots, as a fraction of the font size.
- recttuple (left, bottom, right, top), default: (0, 0, 1, 1)
A rectangle in normalized figure coordinates into which the whole subplots area (including labels) will fit.
- renderersubclass of
Blocking call to interact with the figure.
Wait for user input and return True if a key was pressed, False if a mouse button was pressed and None if no input was given within timeout seconds. Negative values deactivate timeout.