Note
Click here to download the full example code
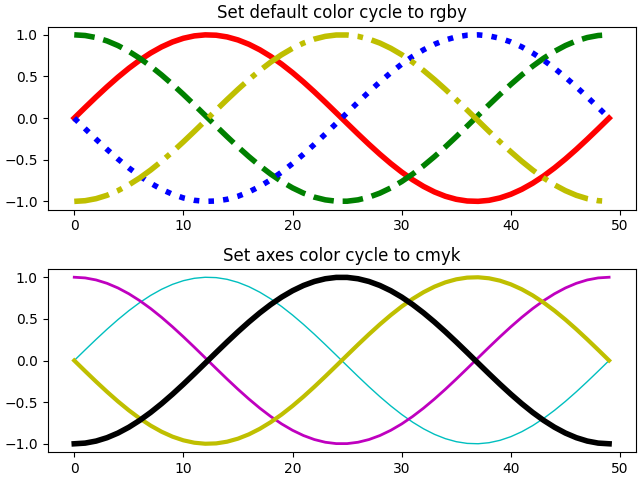
Styling with cycler
Demo of custom property-cycle settings to control colors and other style properties for multi-line plots.
This example demonstrates two different APIs:
- Setting the default rc parameter specifying the property cycle. This affects all subsequent axes (but not axes already created).
- Setting the property cycle for a single pair of axes.
from cycler import cycler
import numpy as np
import matplotlib.pyplot as plt


x = np.linspace(0, 2 * np.pi)
offsets = np.linspace(0, 2*np.pi, 4, endpoint=False)
# Create array with shifted-sine curve along each column
yy = np.transpose([np.sin(x + phi) for phi in offsets])

# 1. Setting prop cycle on default rc parameter
plt.rc('lines', linewidth=4)
plt.rc('axes', prop_cycle=(cycler(color=['r', 'g', 'b', 'y']) +
                           cycler(linestyle=['-', '--', ':', '-.'])))
fig, (ax0, ax1) = plt.subplots(nrows=2, constrained_layout=True)
ax0.plot(yy)
ax0.set_title('Set default color cycle to rgby')

# 2. Define prop cycle for single set of axes
#    For the most general use-case, you can provide a cycler to
#    `.set_prop_cycle`.
#    Here, we use the convenient shortcut that we can alternatively pass
#    one or more properties as keyword arguments. This creates and sets
#    a cycler iterating simultaneously over all properties.
ax1.set_prop_cycle(color=['c', 'm', 'y', 'k'], lw=[1, 2, 3, 4])
ax1.plot(yy)
ax1.set_title('Set axes color cycle to cmyk')

plt.show()
References
The use of the following functions, methods, classes and modules is shown in this example:
import matplotlib
matplotlib.axes.Axes.plot
matplotlib.axes.Axes.set_prop_cycle
Out:
<function _AxesBase.set_prop_cycle at 0x7f616025de50>
Keywords: matplotlib code example, codex, python plot, pyplot Gallery generated by Sphinx-Gallery