Note
Click here to download the full example code
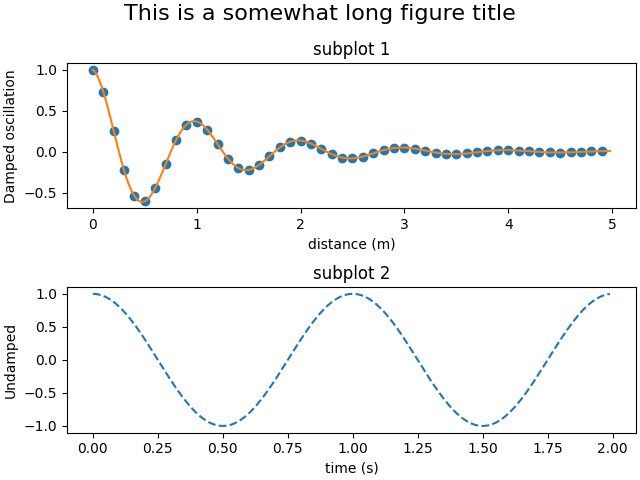
Figure Title
Create a figure with separate subplot titles and a centered figure title.
import matplotlib.pyplot as plt
import numpy as np


def f(t):
    s1 = np.cos(2*np.pi*t)
    e1 = np.exp(-t)
    return s1 * e1

t1 = np.arange(0.0, 5.0, 0.1)
t2 = np.arange(0.0, 5.0, 0.02)
t3 = np.arange(0.0, 2.0, 0.01)


fig, axs = plt.subplots(2, 1, constrained_layout=True)
axs[0].plot(t1, f(t1), 'o', t2, f(t2), '-')
axs[0].set_title('subplot 1')
axs[0].set_xlabel('distance (m)')
axs[0].set_ylabel('Damped oscillation')
fig.suptitle('This is a somewhat long figure title', fontsize=16)

axs[1].plot(t3, np.cos(2*np.pi*t3), '--')
axs[1].set_xlabel('time (s)')
axs[1].set_title('subplot 2')
axs[1].set_ylabel('Undamped')

plt.show()
Keywords: matplotlib code example, codex, python plot, pyplot Gallery generated by Sphinx-Gallery