Note
Click here to download the full example code
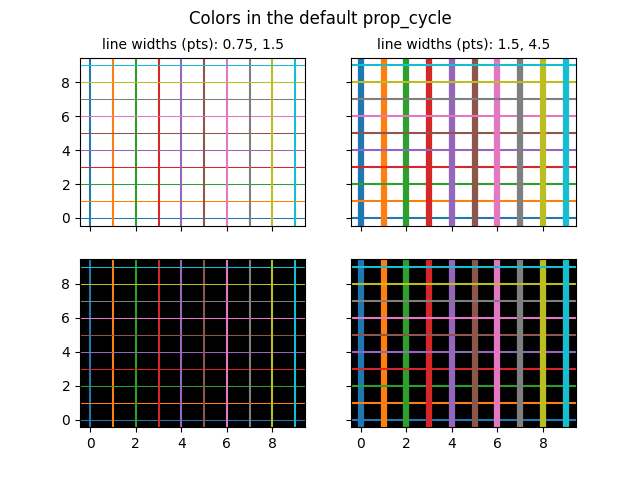
Colors in the default property cycle
Display the colors from the default prop_cycle, which is obtained from the rc parameters.
import numpy as np
import matplotlib.pyplot as plt


prop_cycle = plt.rcParams['axes.prop_cycle']
colors = prop_cycle.by_key()['color']

lwbase = plt.rcParams['lines.linewidth']
thin = lwbase / 2
thick = lwbase * 3

fig, axs = plt.subplots(nrows=2, ncols=2, sharex=True, sharey=True)
for icol in range(2):
    if icol == 0:
        lwx, lwy = thin, lwbase
    else:
        lwx, lwy = lwbase, thick
    for irow in range(2):
        for i, color in enumerate(colors):
            axs[irow, icol].axhline(i, color=color, lw=lwx)
            axs[irow, icol].axvline(i, color=color, lw=lwy)

    axs[1, icol].set_facecolor('k')
    axs[1, icol].xaxis.set_ticks(np.arange(0, 10, 2))
    axs[0, icol].set_title('line widths (pts): %g, %g' % (lwx, lwy),
                           fontsize='medium')

for irow in range(2):
    axs[irow, 0].yaxis.set_ticks(np.arange(0, 10, 2))

fig.suptitle('Colors in the default prop_cycle', fontsize='large')

plt.show()
References
The use of the following functions, methods, classes and modules is shown in this example:
Out:
<function Figure.suptitle at 0x7fdbbffe0b80>
Keywords: matplotlib code example, codex, python plot, pyplot Gallery generated by Sphinx-Gallery