Note
Click here to download the full example code
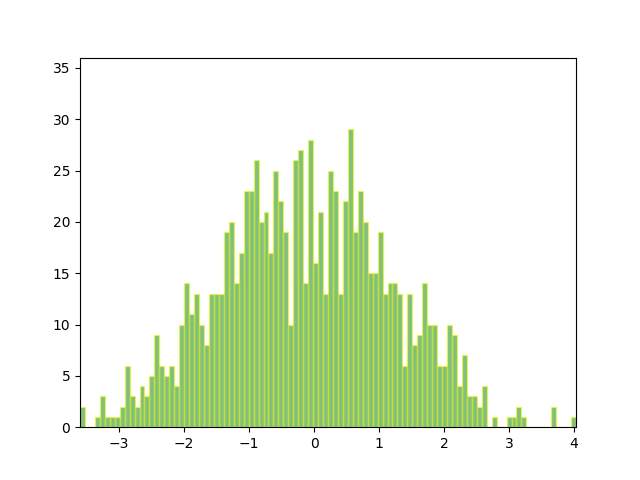
Animated histogram
Use a path patch to draw a bunch of rectangles for an animated histogram.
import numpy as np

import matplotlib.pyplot as plt
import matplotlib.patches as patches
import matplotlib.path as path
import matplotlib.animation as animation

# Fixing random state for reproducibility
np.random.seed(19680801)

# histogram our data with numpy
data = np.random.randn(1000)
n, bins = np.histogram(data, 100)

# get the corners of the rectangles for the histogram
left = np.array(bins[:-1])
right = np.array(bins[1:])
bottom = np.zeros(len(left))
top = bottom + n
nrects = len(left)
Here comes the tricky part -- we have to set up the vertex and path codes
arrays using Path.MOVETO, Path.LINETO and Path.CLOSEPOLY for each
rect.
- We need 1
MOVETOper rectangle, which sets the initial point. - We need 3
LINETO's, which tell Matplotlib to draw lines from vertex 1 to vertex 2, v2 to v3, and v3 to v4. - We then need one
CLOSEPOLYwhich tells Matplotlib to draw a line from the v4 to our initial vertex (theMOVETOvertex), in order to close the polygon.
Note
The vertex for CLOSEPOLY is ignored, but we still need a placeholder
in the verts array to keep the codes aligned with the vertices.
nverts = nrects * (1 + 3 + 1)
verts = np.zeros((nverts, 2))
codes = np.ones(nverts, int) * path.Path.LINETO
codes[0::5] = path.Path.MOVETO
codes[4::5] = path.Path.CLOSEPOLY
verts[0::5, 0] = left
verts[0::5, 1] = bottom
verts[1::5, 0] = left
verts[1::5, 1] = top
verts[2::5, 0] = right
verts[2::5, 1] = top
verts[3::5, 0] = right
verts[3::5, 1] = bottom
To animate the histogram, we need an animate function, which generates
a random set of numbers and updates the locations of the vertices for the
histogram (in this case, only the heights of each rectangle). patch will
eventually be a Patch object.
And now we build the Path and Patch instances for the histogram using
our vertices and codes. We add the patch to the Axes instance, and
setup the FuncAnimation with our animate function.
fig, ax = plt.subplots()
barpath = path.Path(verts, codes)
patch = patches.PathPatch(
    barpath, facecolor='green', edgecolor='yellow', alpha=0.5)
ax.add_patch(patch)

ax.set_xlim(left[0], right[-1])
ax.set_ylim(bottom.min(), top.max())

ani = animation.FuncAnimation(fig, animate, 100, repeat=False, blit=True)
plt.show()
Keywords: matplotlib code example, codex, python plot, pyplot Gallery generated by Sphinx-Gallery