matplotlib.pyplot.colorbar
-
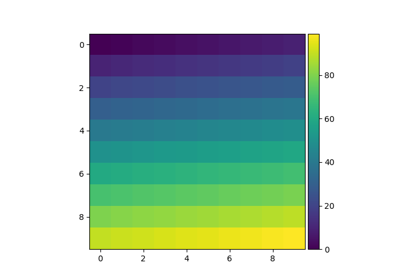
matplotlib.pyplot.colorbar(mappable=None, cax=None, ax=None, \*\*kw)[source]¶ Add a colorbar to a plot.
Function signatures for the
pyplotinterface; all but the first are also method signatures for thecolorbar()method:colorbar(**kwargs) colorbar(mappable, **kwargs) colorbar(mappable, cax=cax, **kwargs) colorbar(mappable, ax=ax, **kwargs)
Parameters: - mappable
The
matplotlib.cm.ScalarMappable(i.e.,Image,ContourSet, etc.) described by this colorbar. This argument is mandatory for theFigure.colorbarmethod but optional for thepyplot.colorbarfunction, which sets the default to the current image.Note that one can create a
ScalarMappable"on-the-fly" to generate colorbars not attached to a previously drawn artist, e.g.fig.colorbar(cm.ScalarMappable(norm=norm, cmap=cmap), ax=ax)
- cax
Axesobject, optional Axes into which the colorbar will be drawn.
- ax
Axes, list of Axes, optional Parent axes from which space for a new colorbar axes will be stolen. If a list of axes is given they will all be resized to make room for the colorbar axes.
- use_gridspecbool, optional
If cax is
None, a new cax is created as an instance of Axes. If ax is an instance of Subplot and use_gridspec isTrue, cax is created as an instance of Subplot using thegridspecmodule.
Returns: - colorbar
Colorbar See also its base class,
ColorbarBase.
Notes
Additional keyword arguments are of two kinds:
axes properties:
Property Description orientation vertical or horizontal fraction 0.15; fraction of original axes to use for colorbar pad 0.05 if vertical, 0.15 if horizontal; fraction of original axes between colorbar and new image axes shrink 1.0; fraction by which to multiply the size of the colorbar aspect 20; ratio of long to short dimensions anchor (0.0, 0.5) if vertical; (0.5, 1.0) if horizontal; the anchor point of the colorbar axes panchor (1.0, 0.5) if vertical; (0.5, 0.0) if horizontal; the anchor point of the colorbar parent axes. If False, the parent axes' anchor will be unchanged colorbar properties:
Property Description extend {'neither', 'both', 'min', 'max'} If not 'neither', make pointed end(s) for out-of- range values. These are set for a given colormap using the colormap set_under and set_over methods. extendfrac {None, 'auto', length, lengths} If set to None, both the minimum and maximum triangular colorbar extensions with have a length of 5% of the interior colorbar length (this is the default setting). If set to 'auto', makes the triangular colorbar extensions the same lengths as the interior boxes (when spacing is set to 'uniform') or the same lengths as the respective adjacent interior boxes (when spacing is set to 'proportional'). If a scalar, indicates the length of both the minimum and maximum triangular colorbar extensions as a fraction of the interior colorbar length. A two-element sequence of fractions may also be given, indicating the lengths of the minimum and maximum colorbar extensions respectively as a fraction of the interior colorbar length. extendrect bool If False the minimum and maximum colorbar extensions will be triangular (the default). If True the extensions will be rectangular. spacing {'uniform', 'proportional'} Uniform spacing gives each discrete color the same space; proportional makes the space proportional to the data interval. ticks None or list of ticks or Locator If None, ticks are determined automatically from the input. format None or str or Formatter If None, the ScalarFormatteris used. If a format string is given, e.g., '%.3f', that is used. An alternativeFormatterobject may be given instead.drawedges bool Whether to draw lines at color boundaries. label str The label on the colorbar's long axis. The following will probably be useful only in the context of indexed colors (that is, when the mappable has norm=NoNorm()), or other unusual circumstances.
Property Description boundaries None or a sequence values None or a sequence which must be of length 1 less than the sequence of boundaries. For each region delimited by adjacent entries in boundaries, the color mapped to the corresponding value in values will be used. If mappable is a
ContourSet, its extend kwarg is included automatically.The shrink kwarg provides a simple way to scale the colorbar with respect to the axes. Note that if cax is specified, it determines the size of the colorbar and shrink and aspect kwargs are ignored.
For more precise control, you can manually specify the positions of the axes objects in which the mappable and the colorbar are drawn. In this case, do not use any of the axes properties kwargs.
It is known that some vector graphics viewers (svg and pdf) renders white gaps between segments of the colorbar. This is due to bugs in the viewers, not Matplotlib. As a workaround, the colorbar can be rendered with overlapping segments:
cbar = colorbar()
cbar.solids.set_edgecolor("face")
draw()
However this has negative consequences in other circumstances, e.g. with semi-transparent images (alpha < 1) and colorbar extensions; therefore, this workaround is not used by default (see issue #1188).