matplotlib.axes.Axes.contour
-
Axes.contour(self, \*args, data=None, \*\*kwargs)[source]¶ Plot contours.
Call signature:
contour([X, Y,] Z, [levels], **kwargs)
contourandcontourfdraw contour lines and filled contours, respectively. Except as noted, function signatures and return values are the same for both versions.Parameters: - X, Yarray-like, optional
The coordinates of the values in Z.
X and Y must both be 2-D with the same shape as Z (e.g. created via
numpy.meshgrid), or they must both be 1-D such thatlen(X) == Mis the number of columns in Z andlen(Y) == Nis the number of rows in Z.If not given, they are assumed to be integer indices, i.e.
X = range(M),Y = range(N).- Zarray-like(N, M)
The height values over which the contour is drawn.
- levelsint or array-like, optional
Determines the number and positions of the contour lines / regions.
If an int n, use n data intervals; i.e. draw n+1 contour lines. The level heights are automatically chosen.
If array-like, draw contour lines at the specified levels. The values must be in increasing order.
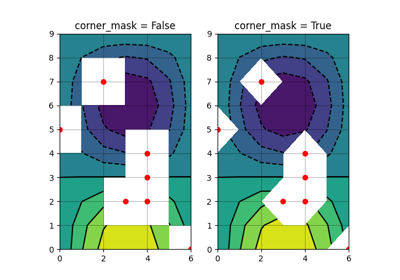
Returns: Other Parameters: - corner_maskbool, optional
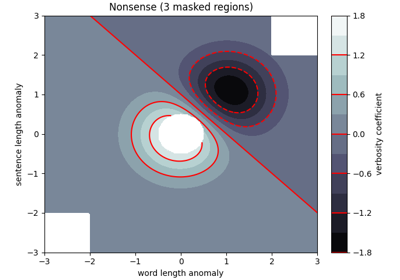
Enable/disable corner masking, which only has an effect if Z is a masked array. If
False, any quad touching a masked point is masked out. IfTrue, only the triangular corners of quads nearest those points are always masked out, other triangular corners comprising three unmasked points are contoured as usual.Defaults to
rcParams["contour.corner_mask"](default: True).- colorscolor string or sequence of colors, optional
The colors of the levels, i.e. the lines for
contourand the areas forcontourf.The sequence is cycled for the levels in ascending order. If the sequence is shorter than the number of levels, it's repeated.
As a shortcut, single color strings may be used in place of one-element lists, i.e.
'red'instead of['red']to color all levels with the same color. This shortcut does only work for color strings, not for other ways of specifying colors.By default (value None), the colormap specified by cmap will be used.
- alphafloat, optional
The alpha blending value, between 0 (transparent) and 1 (opaque).
- cmapstr or
Colormap, optional A
Colormapinstance or registered colormap name. The colormap maps the level values to colors. Defaults torcParams["image.cmap"](default: 'viridis').If both colors and cmap are given, an error is raised.
- norm
Normalize, optional If a colormap is used, the
Normalizeinstance scales the level values to the canonical colormap range [0, 1] for mapping to colors. If not given, the default linear scaling is used.- vmin, vmaxfloat, optional
If not None, either or both of these values will be supplied to the
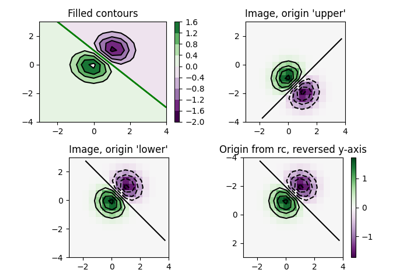
Normalizeinstance, overriding the default color scaling based on levels.- origin{None, 'upper', 'lower', 'image'}, optional
Determines the orientation and exact position of Z by specifying the position of
Z[0, 0]. This is only relevant, if X, Y are not given.- None:
Z[0, 0]is at X=0, Y=0 in the lower left corner. - 'lower':
Z[0, 0]is at X=0.5, Y=0.5 in the lower left corner. - 'upper':
Z[0, 0]is at X=N+0.5, Y=0.5 in the upper left corner. - 'image': Use the value from
rcParams["image.origin"](default: 'upper').
- None:
- extent(x0, x1, y0, y1), optional
If origin is not None, then extent is interpreted as in
imshow: it gives the outer pixel boundaries. In this case, the position of Z[0, 0] is the center of the pixel, not a corner. If origin is None, then (x0, y0) is the position of Z[0, 0], and (x1, y1) is the position of Z[-1,-1].This argument is ignored if X and Y are specified in the call to contour.
- locatorticker.Locator subclass, optional
The locator is used to determine the contour levels if they are not given explicitly via levels. Defaults to
MaxNLocator.- extend{'neither', 'both', 'min', 'max'}, optional, default: 'neither'
Determines the
contourf-coloring of values that are outside the levels range.If 'neither', values outside the levels range are not colored. If 'min', 'max' or 'both', color the values below, above or below and above the levels range.
Values below
min(levels)and abovemax(levels)are mapped to the under/over values of theColormap. Note, that most colormaps do not have dedicated colors for these by default, so that the over and under values are the edge values of the colormap. You may want to set these values explicitly usingColormap.set_underandColormap.set_over.Note
An exising
QuadContourSetdoes not get notified if properties of its colormap are changed. Therefore, an explicit callQuadContourSet.changed()is needed after modifying the colormap. The explicit call can be left out, if a colorbar is assigned to theQuadContourSetbecause it internally callsQuadContourSet.changed().Example:
x = np.arange(1, 10)
y = x.reshape(-1, 1)
h = x * y

cs = plt.contourf(h, levels=[10, 30, 50],
    colors=['#808080', '#A0A0A0', '#C0C0C0'], extend='both')
cs.cmap.set_over('red')
cs.cmap.set_under('blue')
cs.changed()
- xunits, yunitsregistered units, optional
Override axis units by specifying an instance of a
matplotlib.units.ConversionInterface.- antialiasedbool, optional
Enable antialiasing, overriding the defaults. For filled contours, the default is True. For line contours, it is taken from
rcParams["lines.antialiased"](default: True).- nchunkint >= 0, optional
If 0, no subdivision of the domain. Specify a positive integer to divide the domain into subdomains of nchunk by nchunk quads. Chunking reduces the maximum length of polygons generated by the contouring algorithm which reduces the rendering workload passed on to the backend and also requires slightly less RAM. It can however introduce rendering artifacts at chunk boundaries depending on the backend, the antialiased flag and value of alpha.
- linewidthsfloat or sequence of float, optional
Only applies to
contour.The line width of the contour lines.
If a number, all levels will be plotted with this linewidth.
If a sequence, the levels in ascending order will be plotted with the linewidths in the order specified.
Defaults to
rcParams["lines.linewidth"](default: 1.5).- linestyles{None, 'solid', 'dashed', 'dashdot', 'dotted'}, optional
Only applies to
contour.If linestyles is None, the default is 'solid' unless the lines are monochrome. In that case, negative contours will take their linestyle from
rcParams["contour.negative_linestyle"](default: 'dashed') setting.linestyles can also be an iterable of the above strings specifying a set of linestyles to be used. If this iterable is shorter than the number of contour levels it will be repeated as necessary.
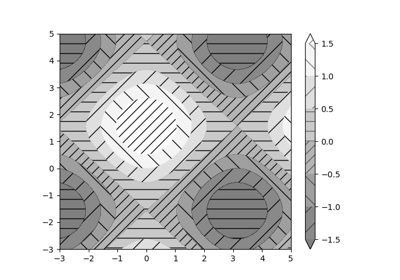
- hatchesList[str], optional
Only applies to
contourf.A list of cross hatch patterns to use on the filled areas. If None, no hatching will be added to the contour. Hatching is supported in the PostScript, PDF, SVG and Agg backends only.
Notes
contourfdiffers from the MATLAB version in that it does not draw the polygon edges. To draw edges, add line contours with calls tocontour.contourffills intervals that are closed at the top; that is, for boundaries z1 and z2, the filled region is:z1 < Z <= z2
except for the lowest interval, which is closed on both sides (i.e. it includes the lowest value).