Third party packages
Several external packages that extend or build on Matplotlib functionality are listed below. They are maintained and distributed separately from Matplotlib and thus need to be installed individually.
Please submit an issue or pull request on GitHub if you have created a package that you would like to have included. We are also happy to host third party packages within the Matplotlib GitHub Organization.
Mapping toolkits
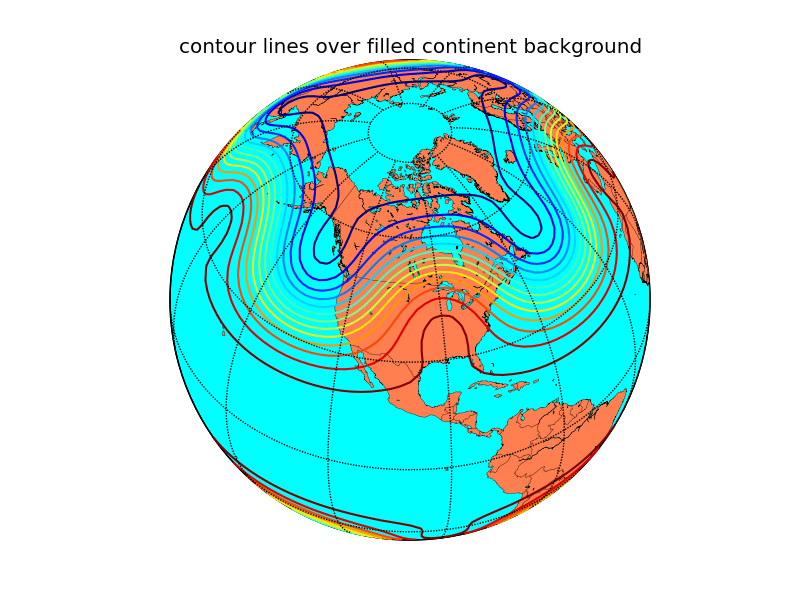
Cartopy
Cartopy builds on top of Matplotlib to provide object oriented map projection definitions and close integration with Shapely for powerful yet easy-to-use vector data processing tools. An example plot from the Cartopy gallery:
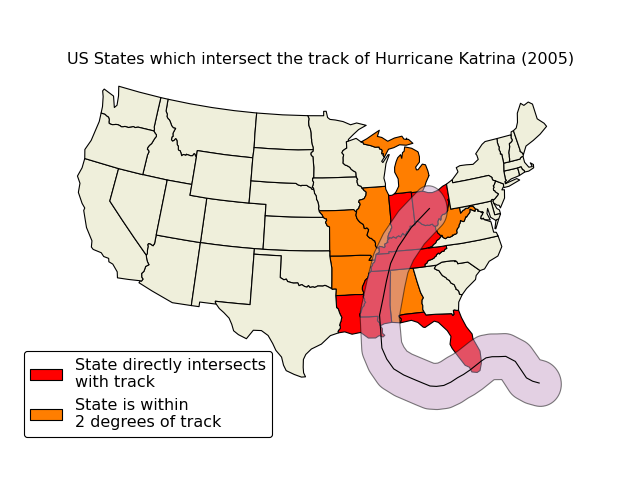
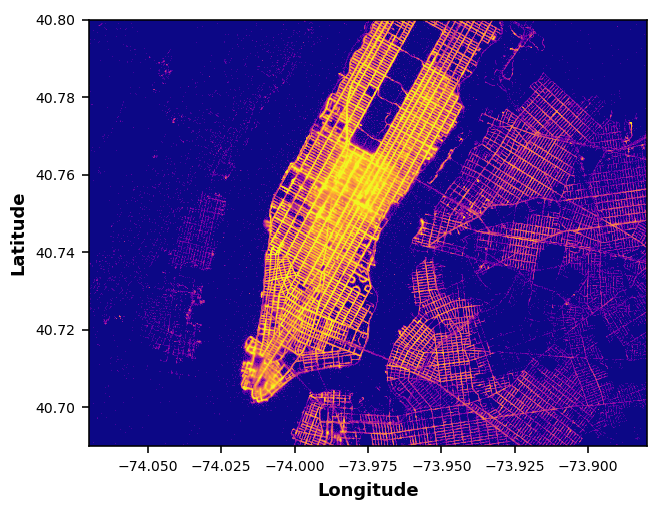
Geoplot
Geoplot builds on top of Matplotlib and Cartopy to provide a "standard library" of simple, powerful, and customizable plot types. An example plot from the Geoplot gallery:


Declarative libraries

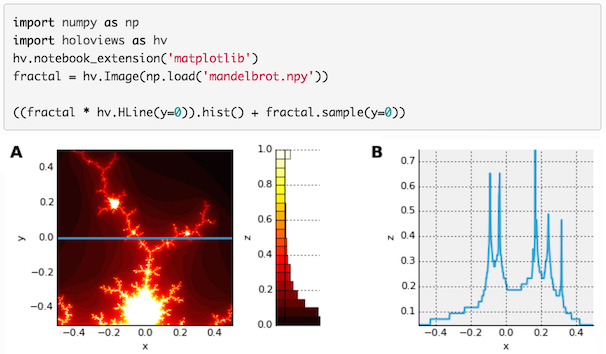
holoviews
holoviews makes it easier to visualize data interactively, especially in a Jupyter notebook, by providing a set of declarative plotting objects that store your data and associated metadata. Your data is then immediately visualizable alongside or overlaid with other data, either statically or with automatically provided widgets for parameter exploration.
Specialty plots
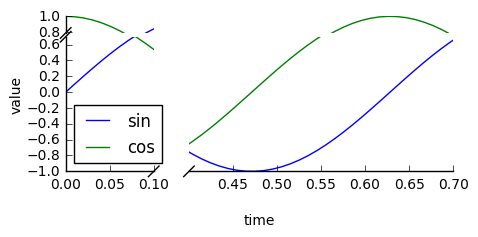
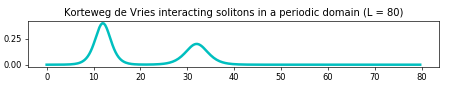
Broken Axes
brokenaxes supplies an axes class that can have a visual break to indicate a discontinuous range.
DeCiDa
DeCiDa is a library of functions and classes for electron device characterization, electronic circuit design and general data visualization and analysis.
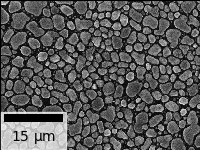
matplotlib-scalebar
matplotlib-scalebar provides a new artist to display a scale bar, aka micron bar.
It is particularly useful when displaying calibrated images plotted using plt.imshow(...).
Matplotlib-Venn
Matplotlib-Venn provides a set of functions for plotting 2- and 3-set area-weighted (or unweighted) Venn diagrams.
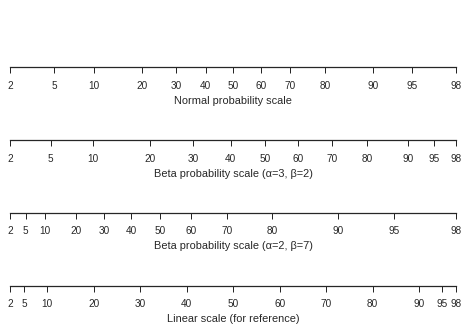
mpl-probscale
mpl-probscale is a small extension
that allows Matplotlib users to specify probabilty scales. Simply importing the
probscale module registers the scale with Matplotlib, making it accessible
via e.g., ax.set_xscale('prob') or plt.yscale('prob').
mpl-scatter-density
mpl-scatter-density is a small package that makes it easy to make scatter plots of large numbers of points using a density map. The following example contains around 13 million points and the plotting (excluding reading in the data) took less than a second on an average laptop:
When used in interactive mode, the density map is downsampled on-the-fly while panning/zooming in order to provide a smooth interactive experience.
mplstereonet
mplstereonet provides stereonets for plotting and analyzing orientation data in Matplotlib.
Natgrid
mpl_toolkits.natgrid is an interface to the natgrid C library for gridding irregularly spaced data.
pyUpSet
pyUpSet is a static Python implementation of the UpSet suite by Lex et al. to explore complex intersections of sets and data frames.
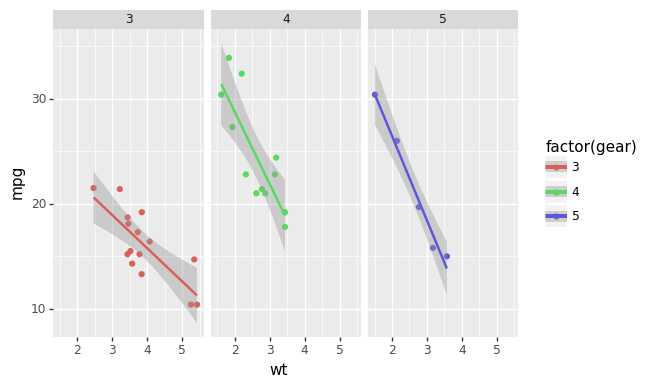
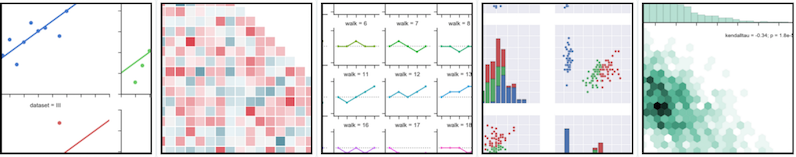
seaborn
seaborn is a high level interface for drawing statistical graphics with Matplotlib. It aims to make visualization a central part of exploring and understanding complex datasets.
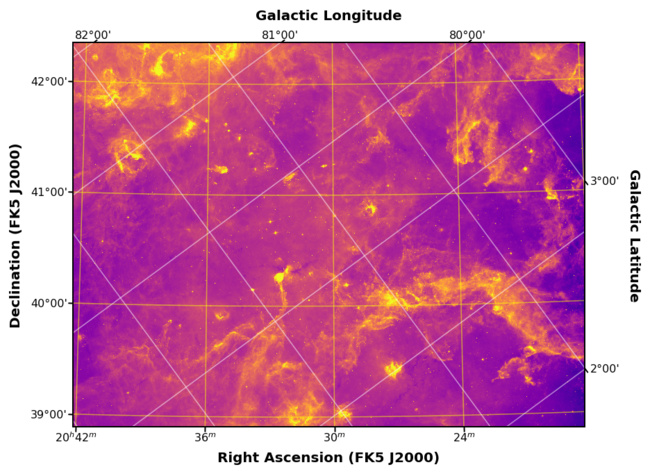
WCSAxes
The Astropy core package includes a submodule called WCSAxes (available at astropy.visualization.wcsaxes) which adds Matplotlib projections for Astronomical image data. The following is an example of a plot made with WCSAxes which includes the original coordinate system of the image and an overlay of a different coordinate system:
Windrose
Windrose is a Python Matplotlib, Numpy library to manage wind data, draw windroses (also known as polar rose plots), draw probability density functions and fit Weibull distributions.
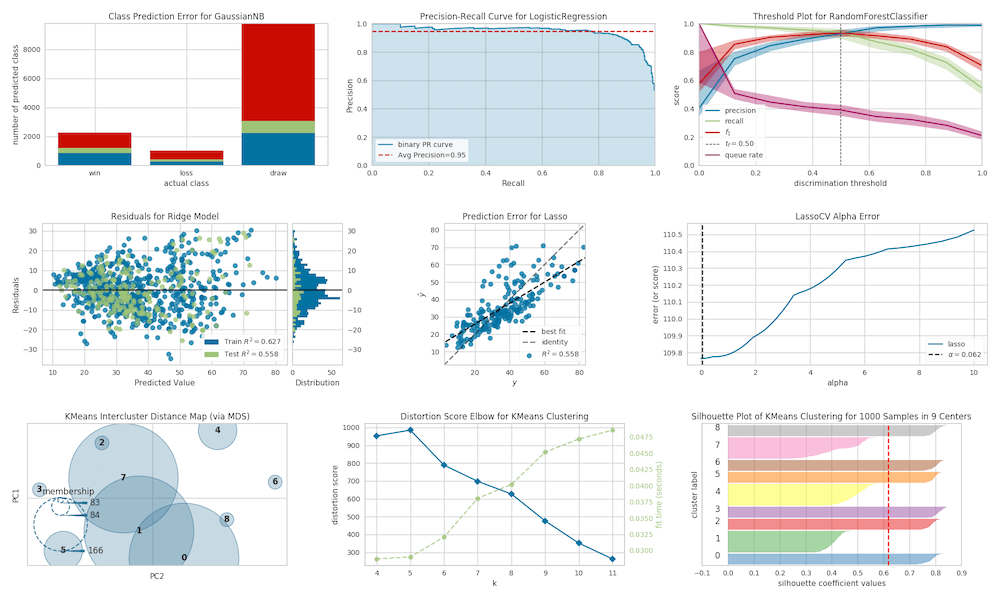
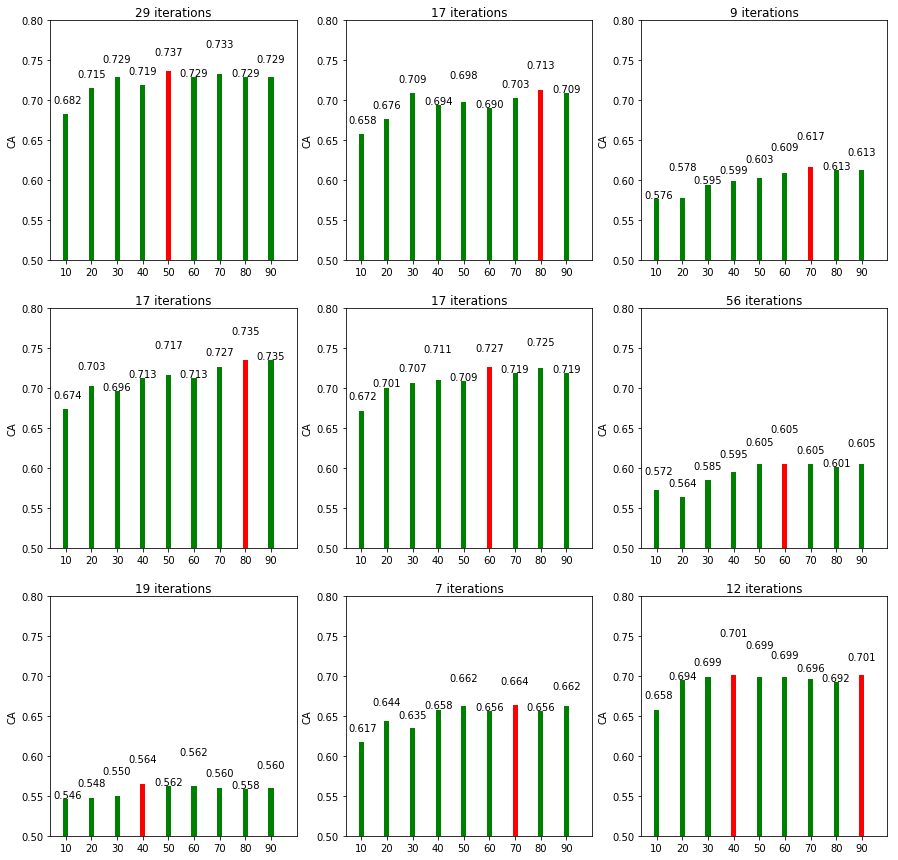
Yellowbrick
Yellowbrick is a suite of visual diagnostic tools for machine learning that enables human steering of the model selection process. Yellowbrick combines scikit-learn with matplotlib using an estimator-based API called the Visualizer, which wraps both sklearn models and matplotlib Axes. Visualizer objects fit neatly into the machine learning workflow allowing data scientists to integrate visual diagnostic and model interpretation tools into experimentation without extra steps.
Interactivity
mplcursors
mplcursors provides interactive data cursors for Matplotlib.
MplDataCursor
MplDataCursor is a toolkit written by Joe Kington to provide interactive "data cursors" (clickable annotation boxes) for Matplotlib.
animatplot
animatplot is a library for producing interactive animated plots with the goal of making production of animated plots almost as easy as static ones.
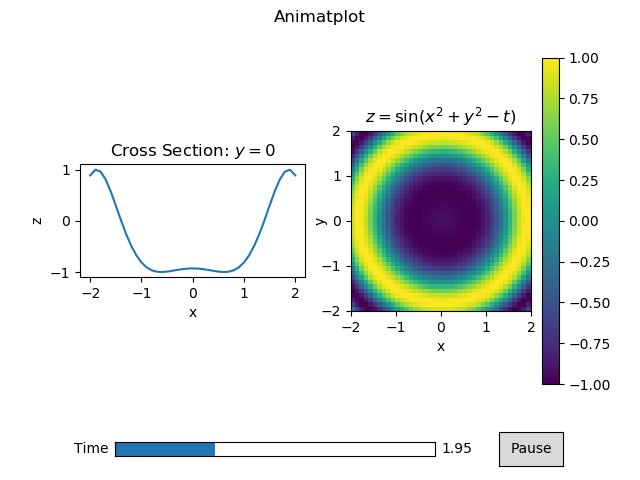
For an animated version of the above picture and more examples, see the animatplot gallery.
Rendering backends
Miscellaneous
adjustText
adjustText is a small library for automatically adjusting text position in Matplotlib plots to minimize overlaps between them, specified points and other objects.
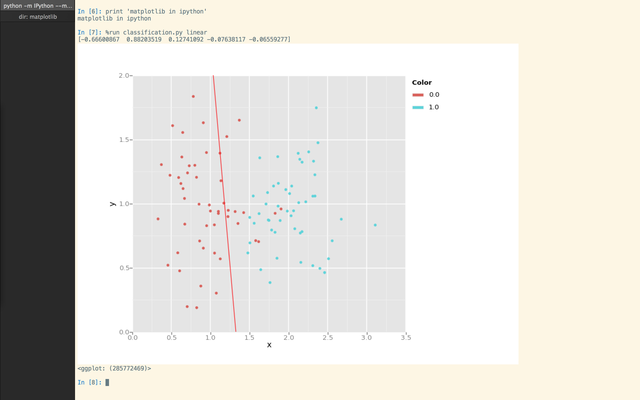
iTerm2 terminal backend
matplotlib_iterm2 is an external Matplotlib backend using the iTerm2 nightly build inline image display feature.
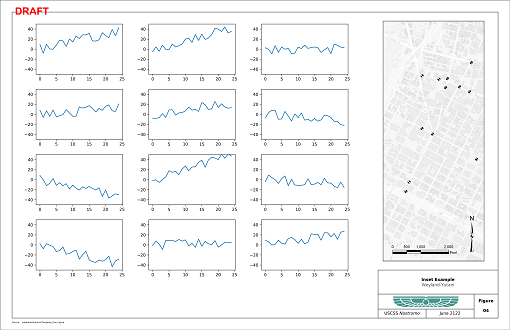
mpl-template
mpl-template provides a customizable way to add engineering figure elements such as a title block, border, and logo.
numpngw
numpngw provides functions for writing
NumPy arrays to PNG and animated PNG files. It also includes the class
AnimatedPNGWriter that can be used to save a Matplotlib animation as an
animated PNG file. See the example on the PyPI page or at the numpngw
github repository.
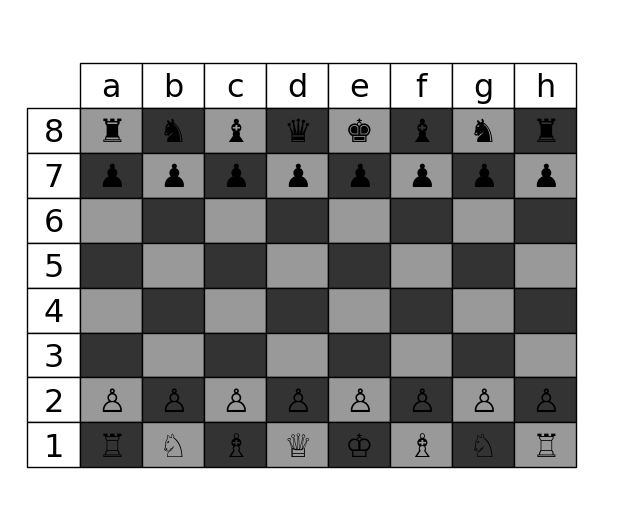
blume
blume provides a replacement for
the Matplotlib table module. It fixes a number of issues with the
existing table. See the blume github repository for more details.
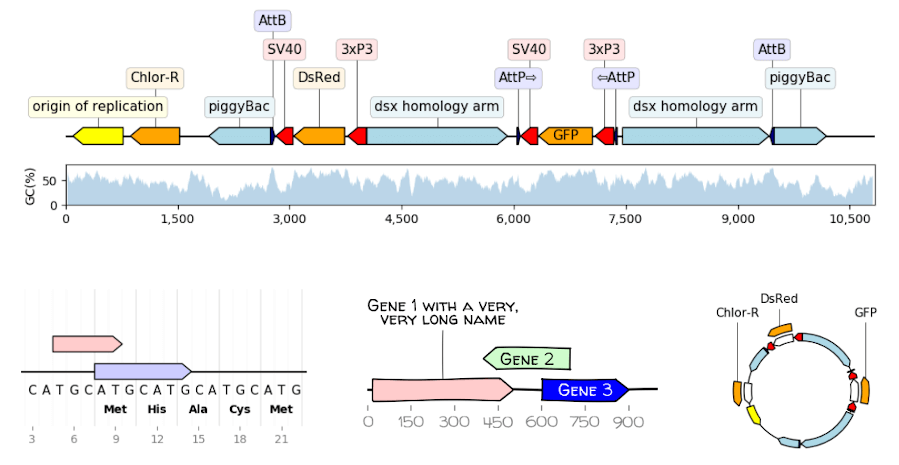
DNA Features Viewer
DNA Features Viewer provides methods to plot annotated DNA sequence maps (possibly along other Matplotlib plots) for Bioinformatics and Synthetic Biology applications.
GUI applications
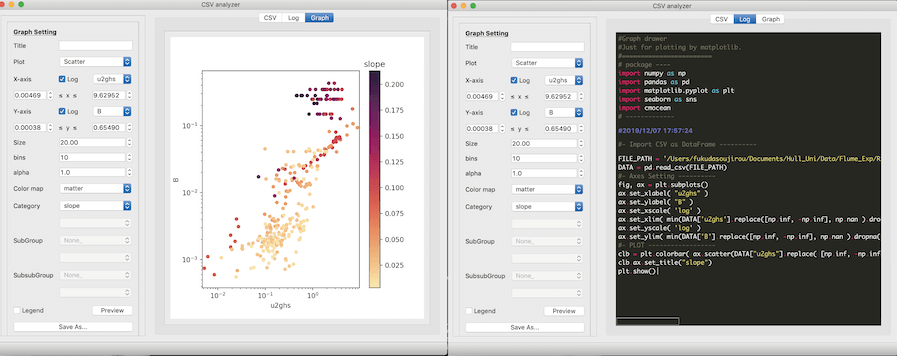
sviewgui
sviewgui is a PyQt-based GUI for
visualisation of data from csv files or pandas.DataFrames. Main features:
- Scatter, line, density, histgram, and box plot types
- Settings for the marker size, line width, number of bins of histgram, color map (from cmocean)
- Save figure as editable PDF
- Code of the plotted graph is available so that it can be reused and modified outside of sviewgui