Note
Click here to download the full example code
Boxplot Demo
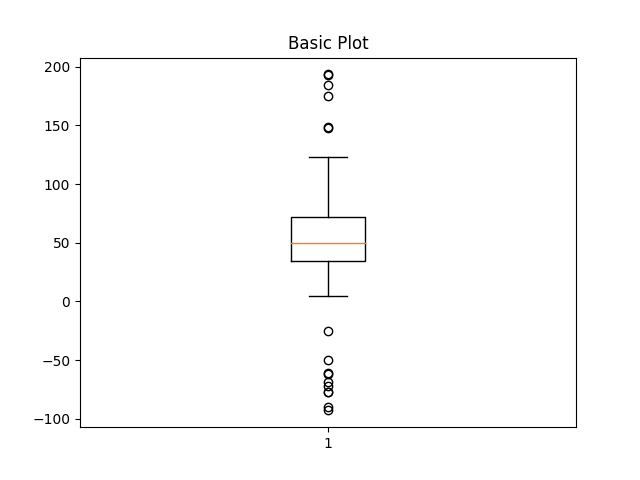
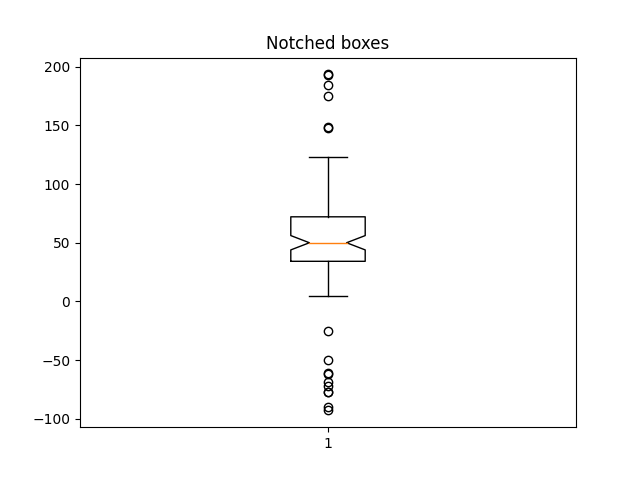
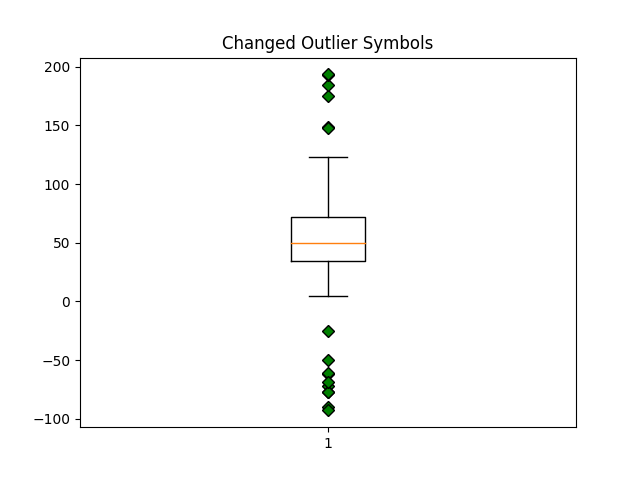
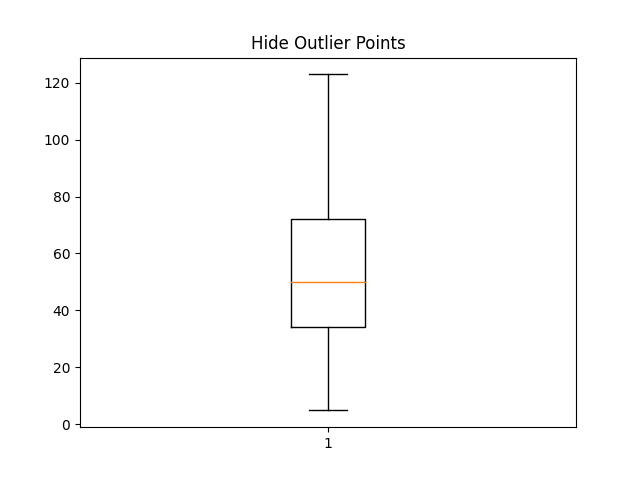
Example boxplot code
import numpy as np
import matplotlib.pyplot as plt

# Fixing random state for reproducibility
np.random.seed(19680801)

# fake up some data
spread = np.random.rand(50) * 100
center = np.ones(25) * 50
flier_high = np.random.rand(10) * 100 + 100
flier_low = np.random.rand(10) * -100
data = np.concatenate((spread, center, flier_high, flier_low))
Out:
{'whiskers': [<matplotlib.lines.Line2D object at 0x7f155a2c4310>, <matplotlib.lines.Line2D object at 0x7f155a2c4c70>], 'caps': [<matplotlib.lines.Line2D object at 0x7f155a2c4df0>, <matplotlib.lines.Line2D object at 0x7f155a34f760>], 'boxes': [<matplotlib.lines.Line2D object at 0x7f155a2c40d0>], 'medians': [<matplotlib.lines.Line2D object at 0x7f155a34ffa0>], 'fliers': [<matplotlib.lines.Line2D object at 0x7f155a34ff40>], 'means': []}
Out:
{'whiskers': [<matplotlib.lines.Line2D object at 0x7f152b114580>, <matplotlib.lines.Line2D object at 0x7f152b114550>], 'caps': [<matplotlib.lines.Line2D object at 0x7f152b114c40>, <matplotlib.lines.Line2D object at 0x7f152b114160>], 'boxes': [<matplotlib.lines.Line2D object at 0x7f15482f5610>], 'medians': [<matplotlib.lines.Line2D object at 0x7f155ef16b20>], 'fliers': [<matplotlib.lines.Line2D object at 0x7f155a2aac10>], 'means': []}
green_diamond = dict(markerfacecolor='g', marker='D')
fig3, ax3 = plt.subplots()
ax3.set_title('Changed Outlier Symbols')
ax3.boxplot(data, flierprops=green_diamond)
Out:
{'whiskers': [<matplotlib.lines.Line2D object at 0x7f155a1a8eb0>, <matplotlib.lines.Line2D object at 0x7f155a1b7250>], 'caps': [<matplotlib.lines.Line2D object at 0x7f155a1b75b0>, <matplotlib.lines.Line2D object at 0x7f155a1b7910>], 'boxes': [<matplotlib.lines.Line2D object at 0x7f155a1a8b50>], 'medians': [<matplotlib.lines.Line2D object at 0x7f155a1b7c40>], 'fliers': [<matplotlib.lines.Line2D object at 0x7f155a1b7f40>], 'means': []}
Out:
{'whiskers': [<matplotlib.lines.Line2D object at 0x7f155a34edf0>, <matplotlib.lines.Line2D object at 0x7f155a33ed00>], 'caps': [<matplotlib.lines.Line2D object at 0x7f155a33eb80>, <matplotlib.lines.Line2D object at 0x7f155a33ed60>], 'boxes': [<matplotlib.lines.Line2D object at 0x7f155a34ea90>], 'medians': [<matplotlib.lines.Line2D object at 0x7f155a33e520>], 'fliers': [], 'means': []}
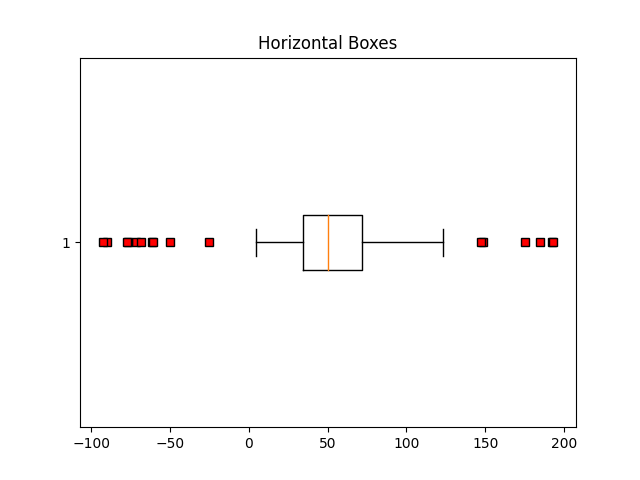
red_square = dict(markerfacecolor='r', marker='s')
fig5, ax5 = plt.subplots()
ax5.set_title('Horizontal Boxes')
ax5.boxplot(data, vert=False, flierprops=red_square)
Out:
{'whiskers': [<matplotlib.lines.Line2D object at 0x7f155a194d60>, <matplotlib.lines.Line2D object at 0x7f155a1a0100>], 'caps': [<matplotlib.lines.Line2D object at 0x7f155a1a0460>, <matplotlib.lines.Line2D object at 0x7f155a1a07c0>], 'boxes': [<matplotlib.lines.Line2D object at 0x7f155a194a00>], 'medians': [<matplotlib.lines.Line2D object at 0x7f155a1a0af0>], 'fliers': [<matplotlib.lines.Line2D object at 0x7f155a1a0df0>], 'means': []}
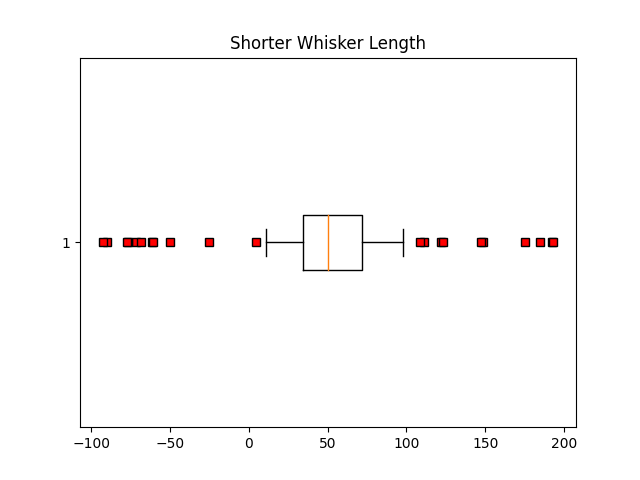
fig6, ax6 = plt.subplots()
ax6.set_title('Shorter Whisker Length')
ax6.boxplot(data, flierprops=red_square, vert=False, whis=0.75)
Out:
{'whiskers': [<matplotlib.lines.Line2D object at 0x7f155a211d90>, <matplotlib.lines.Line2D object at 0x7f155a215130>], 'caps': [<matplotlib.lines.Line2D object at 0x7f155a215490>, <matplotlib.lines.Line2D object at 0x7f155a2157f0>], 'boxes': [<matplotlib.lines.Line2D object at 0x7f155a211a30>], 'medians': [<matplotlib.lines.Line2D object at 0x7f155a215b20>], 'fliers': [<matplotlib.lines.Line2D object at 0x7f155a215e20>], 'means': []}
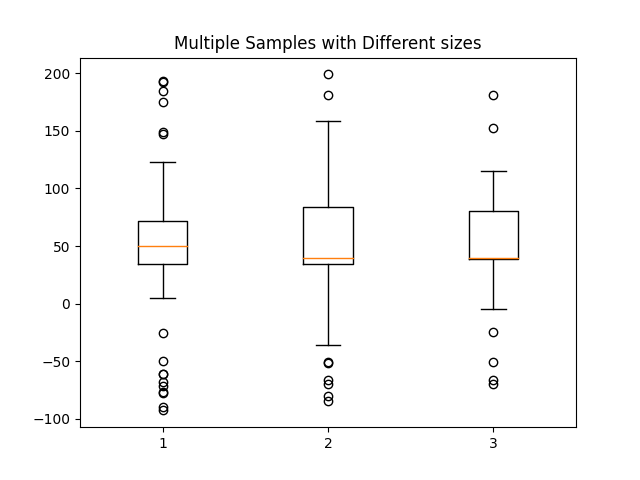
Fake up some more data
spread = np.random.rand(50) * 100
center = np.ones(25) * 40
flier_high = np.random.rand(10) * 100 + 100
flier_low = np.random.rand(10) * -100
d2 = np.concatenate((spread, center, flier_high, flier_low))
data.shape = (-1, 1)
d2.shape = (-1, 1)
Making a 2-D array only works if all the columns are the same length. If they are not, then use a list instead. This is actually more efficient because boxplot converts a 2-D array into a list of vectors internally anyway.
References
The use of the following functions, methods, classes and modules is shown in this example:
import matplotlib
matplotlib.axes.Axes.boxplot
matplotlib.pyplot.boxplot
Out:
<function boxplot at 0x7f154d0c7ca0>
Keywords: matplotlib code example, codex, python plot, pyplot Gallery generated by Sphinx-Gallery