Note
Click here to download the full example code
Stackplot Demo
How to create stackplots with Matplotlib.
Stackplots are generated by plotting different datasets vertically on top of one another rather than overlapping with one another. Below we show some examples to accomplish this with Matplotlib.
import numpy as np
import matplotlib.pyplot as plt
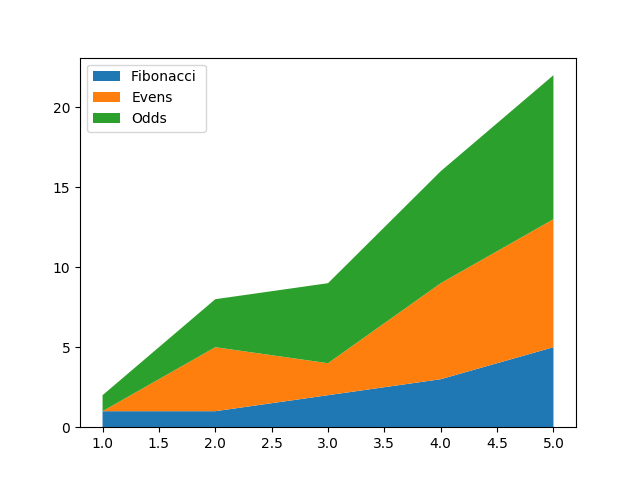
x = [1, 2, 3, 4, 5]
y1 = [1, 1, 2, 3, 5]
y2 = [0, 4, 2, 6, 8]
y3 = [1, 3, 5, 7, 9]
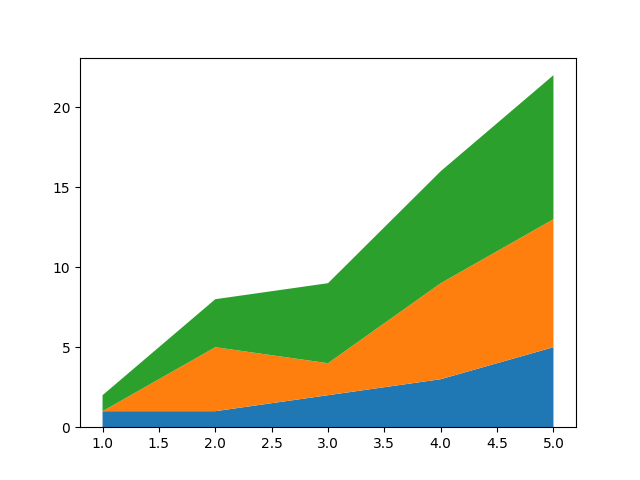
y = np.vstack([y1, y2, y3])
labels = ["Fibonacci ", "Evens", "Odds"]
fig, ax = plt.subplots()
ax.stackplot(x, y1, y2, y3, labels=labels)
ax.legend(loc='upper left')
plt.show()
fig, ax = plt.subplots()
ax.stackplot(x, y)
plt.show()
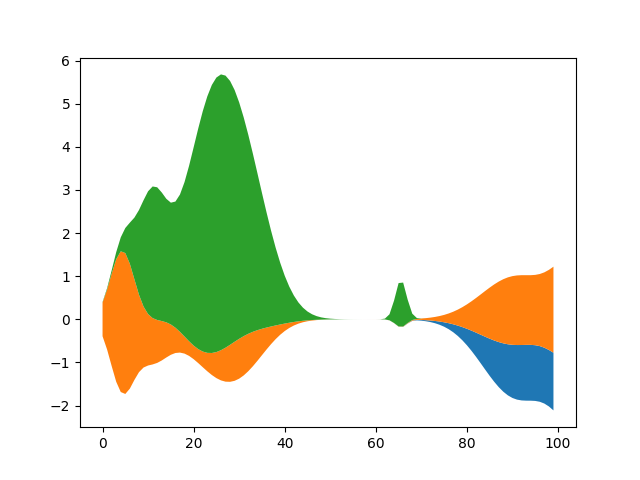
Here we show an example of making a streamgraph using stackplot
def layers(n, m):
    """
    Return *n* random Gaussian mixtures, each of length *m*.
    """
    def bump(a):
        x = 1 / (.1 + np.random.random())
        y = 2 * np.random.random() - .5
        z = 10 / (.1 + np.random.random())
        for i in range(m):
            w = (i / m - y) * z
            a[i] += x * np.exp(-w * w)
    a = np.zeros((m, n))
    for i in range(n):
        for j in range(5):
            bump(a[:, i])
    return a


d = layers(3, 100)

fig, ax = plt.subplots()
ax.stackplot(range(100), d.T, baseline='wiggle')
plt.show()
Keywords: matplotlib code example, codex, python plot, pyplot Gallery generated by Sphinx-Gallery