matplotlib.colors.PowerNorm
-
class
matplotlib.colors.PowerNorm(gamma, vmin=None, vmax=None, clip=False)[source]¶ Bases:
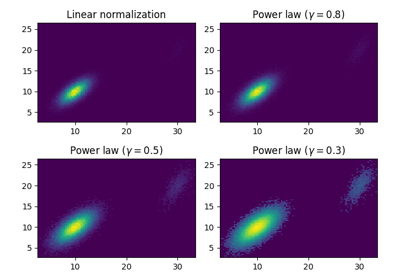
matplotlib.colors.NormalizeLinearly map a given value to the 0-1 range and then apply a power-law normalization over that range.
If vmin or vmax is not given, they are initialized from the minimum and maximum value respectively of the first input processed. That is, __call__(A) calls autoscale_None(A). If clip is True and the given value falls outside the range, the returned value will be 0 or 1, whichever is closer. Returns 0 if
vmin==vmax
Works with scalars or arrays, including masked arrays. If clip is True, masked values are set to 1; otherwise they remain masked. Clipping silently defeats the purpose of setting the over, under, and masked colors in the colormap, so it is likely to lead to surprises; therefore the default is clip = False.