mpl_toolkits.axisartist.axis_artist.AxisArtist#
- class mpl_toolkits.axisartist.axis_artist.AxisArtist(axes, helper, offset=None, axis_direction='bottom', **kwargs)[source]#
Bases:
ArtistAn artist which draws axis (a line along which the n-th axes coord is constant) line, ticks, tick labels, and axis label.
- Parameters:
- property LABELPAD#
- draw(renderer)[source]#
Draw the Artist (and its children) using the given renderer.
This has no effect if the artist is not visible (
Artist.get_visiblereturns False).- Parameters:
- renderer
RendererBasesubclass.
- renderer
Notes
This method is overridden in the Artist subclasses.
- get_tightbbox(renderer=None)[source]#
Get the artist's bounding box in display space, taking clipping into account.
- Parameters:
- renderer
RendererBase, optional Renderer used to draw the figure (i.e.
fig.canvas.get_renderer()).
- renderer
- Returns:
Bboxor NoneThe enclosing bounding box (in figure pixel coordinates), or None if clipping results in no intersection.
See also
Artist.get_window_extentGet the artist bounding box, ignoring clipping.
- set(*, agg_filter=<UNSET>, alpha=<UNSET>, animated=<UNSET>, axis_direction=<UNSET>, axislabel_direction=<UNSET>, axisline_style=<UNSET>, clip_box=<UNSET>, clip_on=<UNSET>, clip_path=<UNSET>, gid=<UNSET>, in_layout=<UNSET>, label=<UNSET>, mouseover=<UNSET>, path_effects=<UNSET>, picker=<UNSET>, rasterized=<UNSET>, sketch_params=<UNSET>, snap=<UNSET>, ticklabel_direction=<UNSET>, transform=<UNSET>, url=<UNSET>, visible=<UNSET>, zorder=<UNSET>)[source]#
Set multiple properties at once.
a.set(a=A, b=B, c=C)
is equivalent to
a.set_a(A)
a.set_b(B)
a.set_c(C)
In addition to the full property names, aliases are also supported, e.g.
set(lw=2)is equivalent toset(linewidth=2), but it is an error to pass both simultaneously.The order of the individual setter calls matches the order of parameters in
set(). However, most properties do not depend on each other so that order is rarely relevant.Supported properties are
Property
Description
a filter function, which takes a (m, n, 3) float array and a dpi value, and returns a (m, n, 3) array and two offsets from the bottom left corner of the image
float or None
bool
{"left", "bottom", "right", "top"}
{"+", "-"}
str or None
BboxBaseor Nonebool
Patch or (Path, Transform) or None
str
bool
unknown
bool
list of
AbstractPathEffectNone or bool or float or callable
bool
(scale: float, length: float, randomness: float)
bool or None
{"+", "-"}
str
bool
float
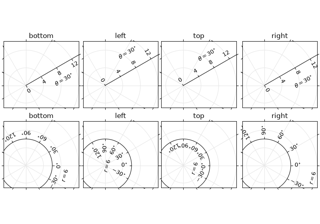
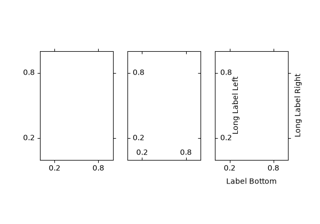
- set_axis_direction(axis_direction)[source]#
Adjust the direction, text angle, and text alignment of tick labels and axis labels following the Matplotlib convention for the rectangle axes.
The axis_direction must be one of [left, right, bottom, top].
Property
left
bottom
right
top
ticklabel direction
"-"
"+"
"+"
"-"
axislabel direction
"-"
"+"
"+"
"-"
ticklabel angle
90
0
-90
180
ticklabel va
center
baseline
center
baseline
ticklabel ha
right
center
right
center
axislabel angle
180
0
0
180
axislabel va
center
top
center
bottom
axislabel ha
right
center
right
center
Note that the direction "+" and "-" are relative to the direction of the increasing coordinate. Also, the text angles are actually relative to (90 + angle of the direction to the ticklabel), which gives 0 for bottom axis.
- Parameters:
- axis_direction{"left", "bottom", "right", "top"}
- set_axislabel_direction(label_direction)[source]#
Adjust the direction of the axis label.
Note that the label_directions '+' and '-' are relative to the direction of the increasing coordinate.
- Parameters:
- label_direction{"+", "-"}
- set_axisline_style(axisline_style=None, **kwargs)[source]#
Set the axisline style.
The new style is completely defined by the passed attributes. Existing style attributes are forgotten.
- Parameters:
- axisline_stylestr or None
The line style, e.g. '->', optionally followed by a comma-separated list of attributes. Alternatively, the attributes can be provided as keywords.
If None this returns a string containing the available styles.
Examples
The following two commands are equal:
>>> set_axisline_style("->,size=1.5")
>>> set_axisline_style("->", size=1.5)
- set_label(s)[source]#
Set a label that will be displayed in the legend.
- Parameters:
- sobject
s will be converted to a string by calling
str.
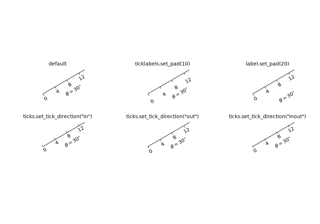
- set_ticklabel_direction(tick_direction)[source]#
Adjust the direction of the tick labels.
Note that the tick_directions '+' and '-' are relative to the direction of the increasing coordinate.
- Parameters:
- tick_direction{"+", "-"}
- toggle(all=None, ticks=None, ticklabels=None, label=None)[source]#
Toggle visibility of ticks, ticklabels, and (axis) label. To turn all off,
axis.toggle(all=False)
To turn all off but ticks on
axis.toggle(all=False, ticks=True)
To turn all on but (axis) label off
axis.toggle(all=True, label=False)
- zorder = 2.5#