Version 3.1.3
Note
Click here to download the full example code
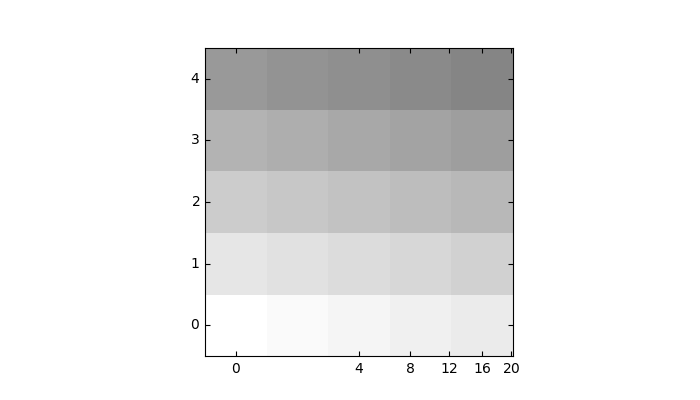
Custom grid and ticklines.
This example demonstrates how to use GridHelperCurveLinear to define custom grids and ticklines by applying a transformation on the grid. As showcase on the plot, a 5x5 matrix is displayed on the axes.
import numpy as np
import matplotlib.pyplot as plt

from mpl_toolkits.axisartist.grid_helper_curvelinear import \
    GridHelperCurveLinear
from mpl_toolkits.axisartist.grid_finder import MaxNLocator
from mpl_toolkits.axisartist.axislines import Subplot

import mpl_toolkits.axisartist.angle_helper as angle_helper


def curvelinear_test1(fig):
    """
    grid for custom transform.
    """

    def tr(x, y):
        sgn = np.sign(x)
        x, y = np.abs(np.asarray(x)), np.asarray(y)
        return sgn*x**.5, y

    def inv_tr(x, y):
        sgn = np.sign(x)
        x, y = np.asarray(x), np.asarray(y)
        return sgn*x**2, y

    extreme_finder = angle_helper.ExtremeFinderCycle(20, 20,
                                                     lon_cycle=None,
                                                     lat_cycle=None,
                                                     # (0, np.inf),
                                                     lon_minmax=None,
                                                     lat_minmax=None,
                                                     )

    grid_helper = GridHelperCurveLinear((tr, inv_tr),
                                        extreme_finder=extreme_finder,
                                        # better tick density
                                        grid_locator1=MaxNLocator(nbins=6),
                                        grid_locator2=MaxNLocator(nbins=6))

    ax1 = Subplot(fig, 111, grid_helper=grid_helper)
    # ax1 will have a ticks and gridlines defined by the given
    # transform (+ transData of the Axes). Note that the transform of
    # the Axes itself (i.e., transData) is not affected by the given
    # transform.

    fig.add_subplot(ax1)

    ax1.imshow(np.arange(25).reshape(5, 5),
               vmax=50, cmap=plt.cm.gray_r,
               interpolation="nearest",
               origin="lower")


if __name__ == "__main__":
    fig = plt.figure(figsize=(7, 4))
    curvelinear_test1(fig)
    plt.show()
Keywords: matplotlib code example, codex, python plot, pyplot Gallery generated by Sphinx-Gallery