matplotlib.axes
matplotlib.axes.Axes.set_ylabel
Axes.
set_ylabel
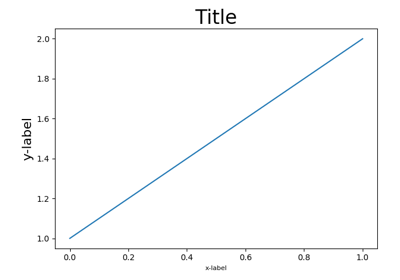
Set the label for the y-axis.
The label text.
Spacing in points from the axes bounding box including ticks and tick labels.
Text
Text properties control the appearance of the label.
See also
text
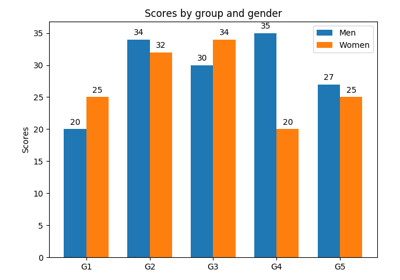
Grouped bar chart with labels
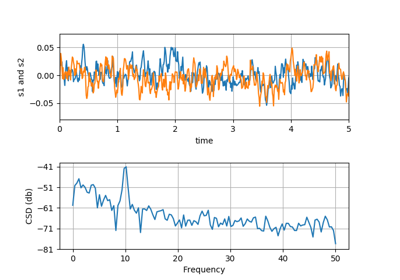
CSD Demo
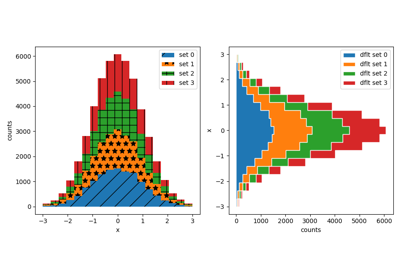
Hatch-filled histograms
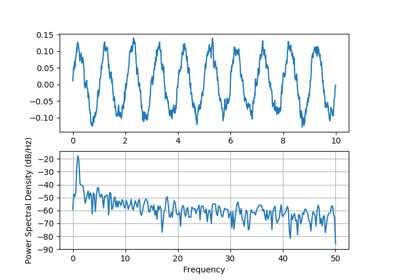
Psd Demo
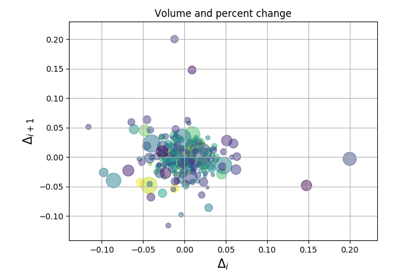
Scatter Demo2
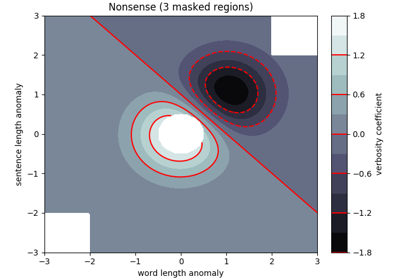
Contourf Demo
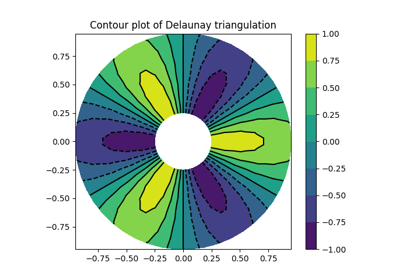
Tricontour Demo
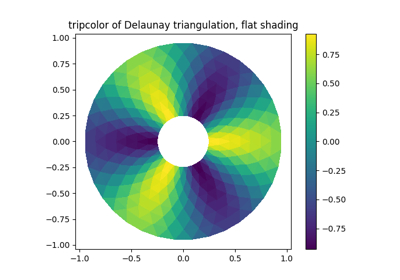
Tripcolor Demo
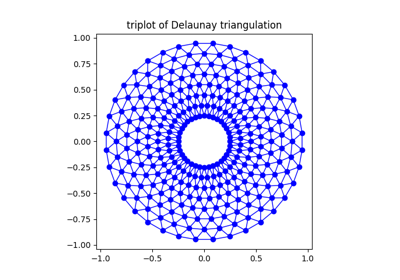
Triplot Demo
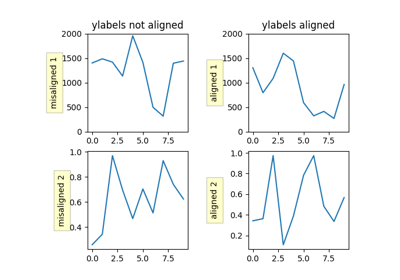
Aligning Labels
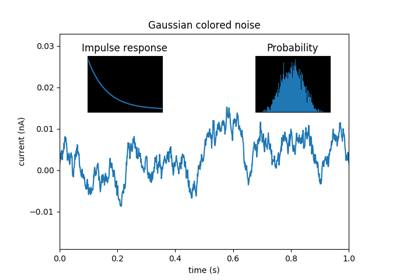
Axes Demo
Resizing axes with constrained layout
Resizing axes with tight layout
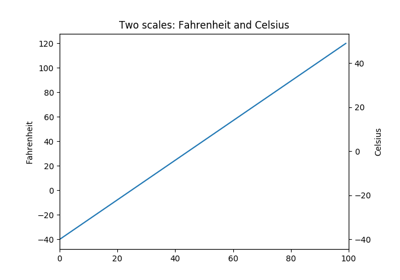
Different scales on the same axes
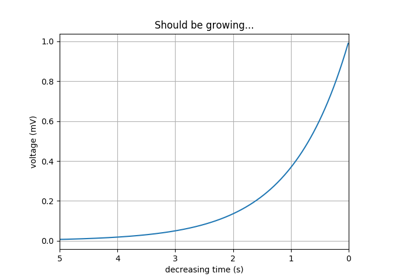
Invert Axes
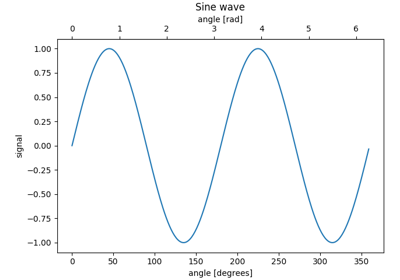
Secondary Axis
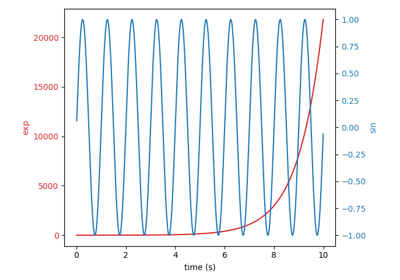
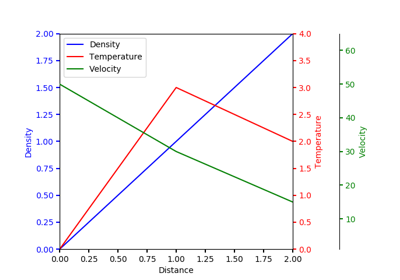
Plots with different scales
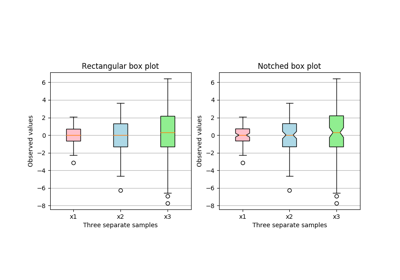
Box plots with custom fill colors
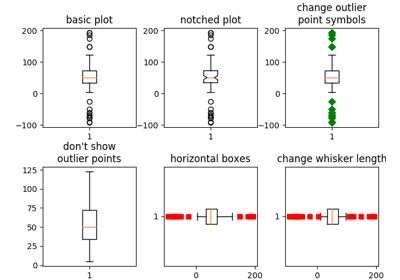
Boxplots
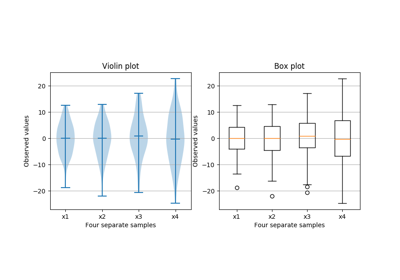
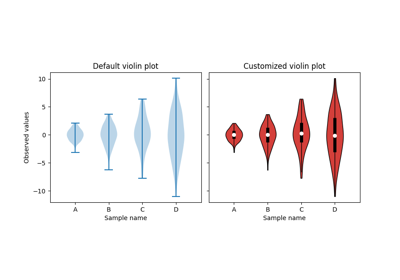
Box plot vs. violin plot comparison
Violin plot customization
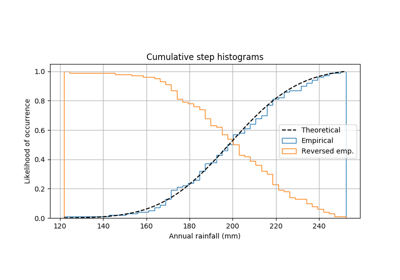
Using histograms to plot a cumulative distribution
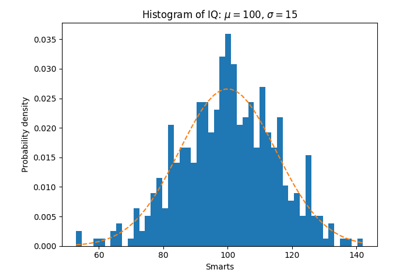
Demo of the histogram (hist) function with a few features
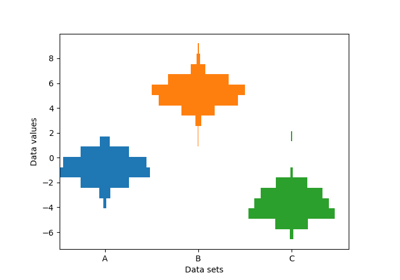
Producing multiple histograms side by side
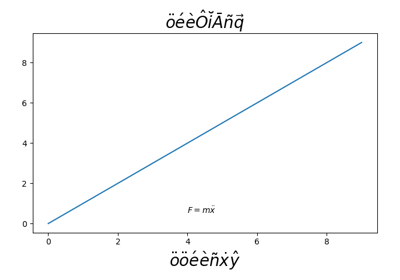
Using accented text in matplotlib
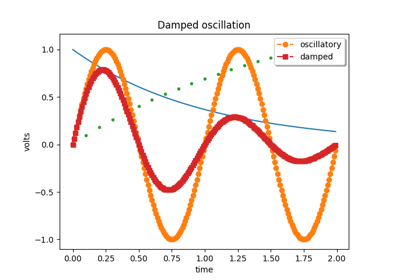
Legend Demo
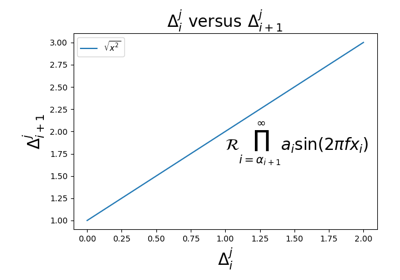
Mathtext Demo
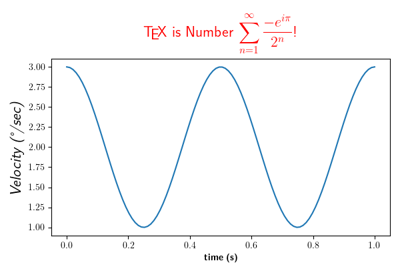
Rendering math equation using TeX
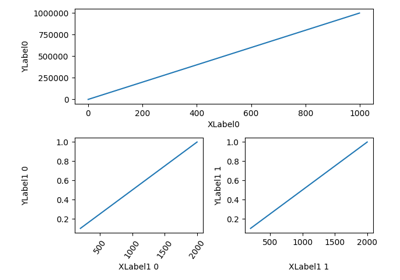
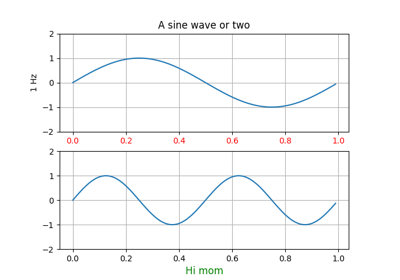
Align y-labels
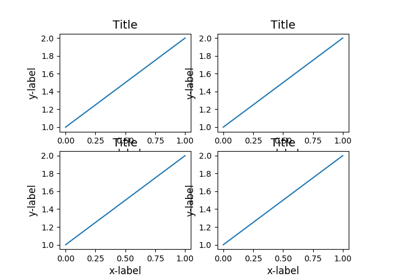
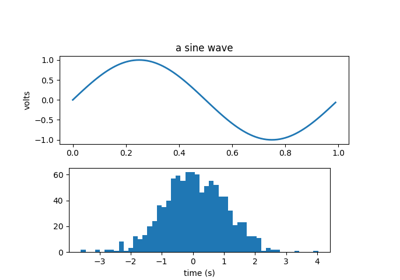
Simple axes labels
Text Commands
Color Demo
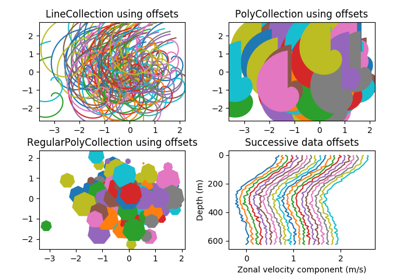
Line, Poly and RegularPoly Collection with autoscaling
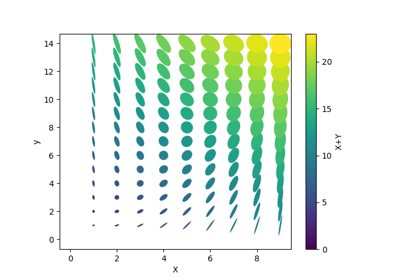
Ellipse Collection
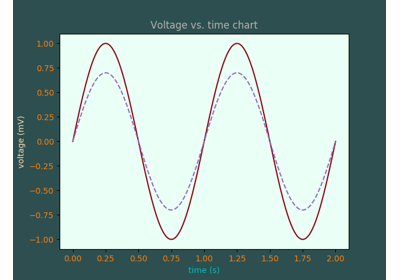
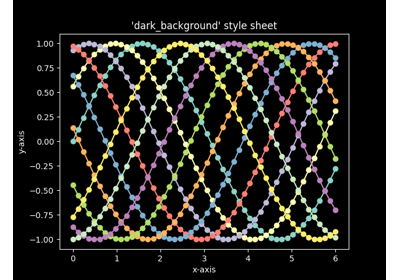
Dark background style sheet
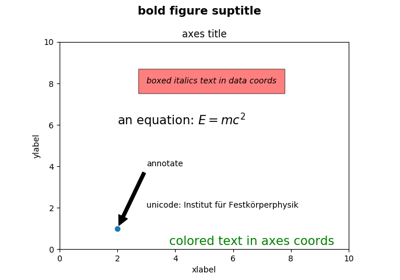
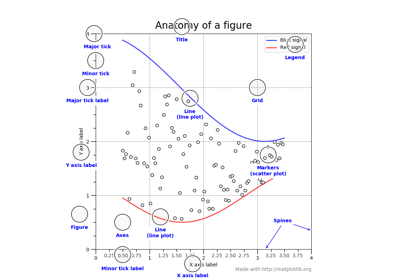
Anatomy of a figure
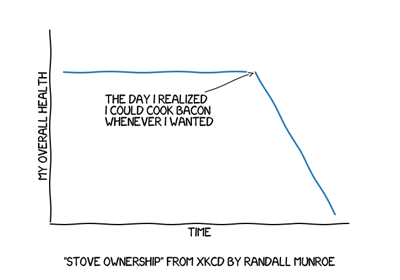
XKCD
Pythonic Matplotlib
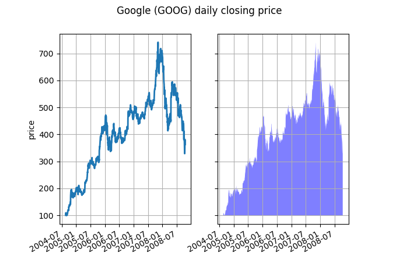
Fill Between and Alpha
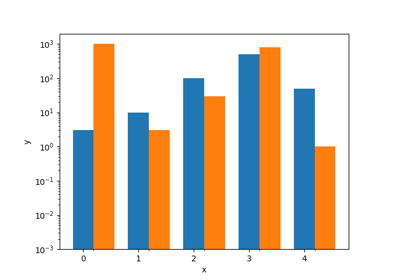
Log Bar
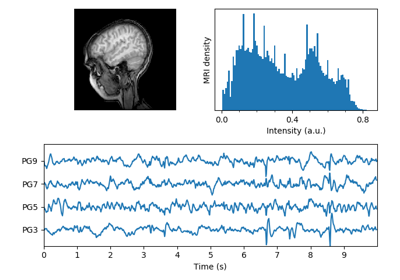
MRI With EEG
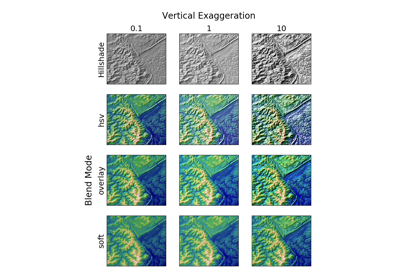
Topographic hillshading
Multiple Yaxis With Spines
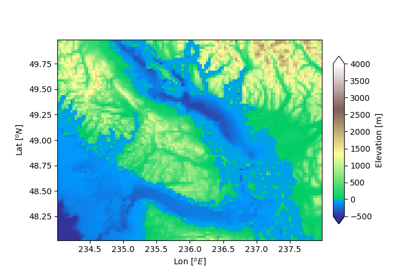
DivergingNorm colormap normalization
Artist tutorial
Constrained Layout Guide
Text in Matplotlib Plots