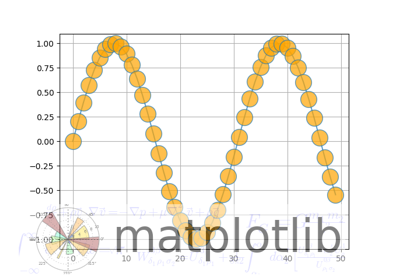
| Parameters: |
- b : bool or None, optional
Whether to show the grid lines. If any kwargs are supplied,
it is assumed you want the grid on and b will be set to True.
If b is None and there are no kwargs, this toggles the
visibility of the lines.
- which : {'major', 'minor', 'both'}, optional
The grid lines to apply the changes on.
- axis : {'both', 'x', 'y'}, optional
The axis to apply the changes on.
- **kwargs :
Line2D properties
Define the line properties of the grid, e.g.:
grid(color='r', linestyle='-', linewidth=2)
Valid kwargs are
| Property |
Description |
|---|
agg_filter |
a filter function, which takes a (m, n, 3) float array and a dpi value, and returns a (m, n, 3) array |
alpha |
float |
animated |
bool |
antialiased or aa |
bool |
clip_box |
Bbox |
clip_on |
bool |
clip_path |
[(Path, Transform) | Patch | None] |
color or c |
color |
contains |
callable |
dash_capstyle |
{'butt', 'round', 'projecting'} |
dash_joinstyle |
{'miter', 'round', 'bevel'} |
dashes |
sequence of floats (on/off ink in points) or (None, None) |
drawstyle or ds |
{'default', 'steps', 'steps-pre', 'steps-mid', 'steps-post'}, default: 'default' |
figure |
Figure |
fillstyle |
{'full', 'left', 'right', 'bottom', 'top', 'none'} |
gid |
str |
in_layout |
bool |
label |
object |
linestyle or ls |
{'-', '--', '-.', ':', '', (offset, on-off-seq), ...} |
linewidth or lw |
float |
marker |
marker style |
markeredgecolor or mec |
color |
markeredgewidth or mew |
float |
markerfacecolor or mfc |
color |
markerfacecoloralt or mfcalt |
color |
markersize or ms |
float |
markevery |
None or int or (int, int) or slice or List[int] or float or (float, float) |
path_effects |
AbstractPathEffect |
picker |
float or callable[[Artist, Event], Tuple[bool, dict]] |
pickradius |
float |
rasterized |
bool or None |
sketch_params |
(scale: float, length: float, randomness: float) |
snap |
bool or None |
solid_capstyle |
{'butt', 'round', 'projecting'} |
solid_joinstyle |
{'miter', 'round', 'bevel'} |
transform |
matplotlib.transforms.Transform |
url |
str |
visible |
bool |
xdata |
1D array |
ydata |
1D array |
zorder |
float |
|
|---|