Version 3.1.0
Note
Click here to download the full example code
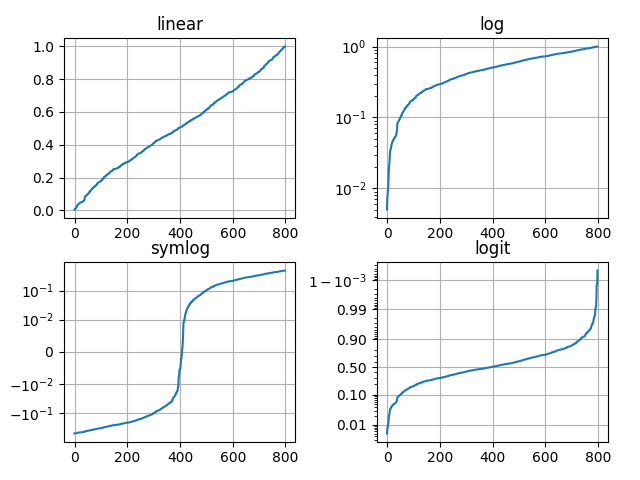
Create plots on different scales. Here a linear, a logarithmic, a symmetric logarithmic and a logit scale are shown. For further examples also see the Scales section of the gallery.
import numpy as np
import matplotlib.pyplot as plt

from matplotlib.ticker import NullFormatter  # useful for `logit` scale

# Fixing random state for reproducibility
np.random.seed(19680801)

# make up some data in the interval ]0, 1[
y = np.random.normal(loc=0.5, scale=0.4, size=1000)
y = y[(y > 0) & (y < 1)]
y.sort()
x = np.arange(len(y))

# plot with various axes scales
plt.figure()

# linear
plt.subplot(221)
plt.plot(x, y)
plt.yscale('linear')
plt.title('linear')
plt.grid(True)


# log
plt.subplot(222)
plt.plot(x, y)
plt.yscale('log')
plt.title('log')
plt.grid(True)


# symmetric log
plt.subplot(223)
plt.plot(x, y - y.mean())
plt.yscale('symlog', linthreshy=0.01)
plt.title('symlog')
plt.grid(True)

# logit
plt.subplot(224)
plt.plot(x, y)
plt.yscale('logit')
plt.title('logit')
plt.grid(True)
# Format the minor tick labels of the y-axis into empty strings with
# `NullFormatter`, to avoid cumbering the axis with too many labels.
plt.gca().yaxis.set_minor_formatter(NullFormatter())
# Adjust the subplot layout, because the logit one may take more space
# than usual, due to y-tick labels like "1 - 10^{-3}"
plt.subplots_adjust(top=0.92, bottom=0.08, left=0.10, right=0.95, hspace=0.25,
                    wspace=0.35)

plt.show()
The use of the following functions, methods, classes and modules is shown in this example:
Keywords: matplotlib code example, codex, python plot, pyplot Gallery generated by Sphinx-Gallery