You are reading an old version of the documentation (v3.1.0). For the latest version see https://matplotlib.org/stable/api/_as_gen/matplotlib.pyplot.yscale.html
Version 3.1.0
matplotlib
Fork me on GitHub

Table of Contents

matplotlib.pyplot.yscale

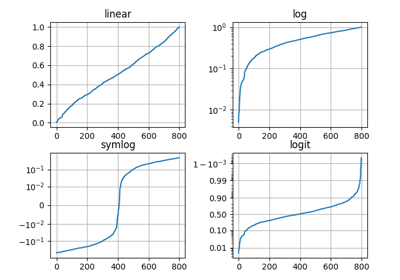
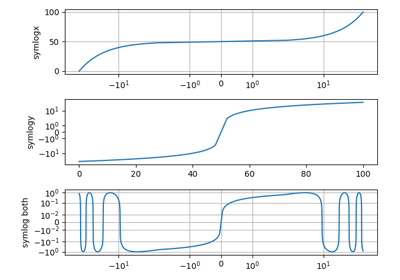
matplotlib.pyplot.yscale(value, **kwargs)[source]

Set the y-axis scale.

Parameters:
value : {"linear", "log", "symlog", "logit", ...}

The axis scale type to apply.

**kwargs

Different keyword arguments are accepted, depending on the scale. See the respective class keyword arguments:

Notes

By default, Matplotlib supports the above mentioned scales. Additionally, custom scales may be registered using matplotlib.scale.register_scale. These scales can then also be used here.

Examples using matplotlib.pyplot.yscale