Version 3.0.3
Note
Click here to download the full example code
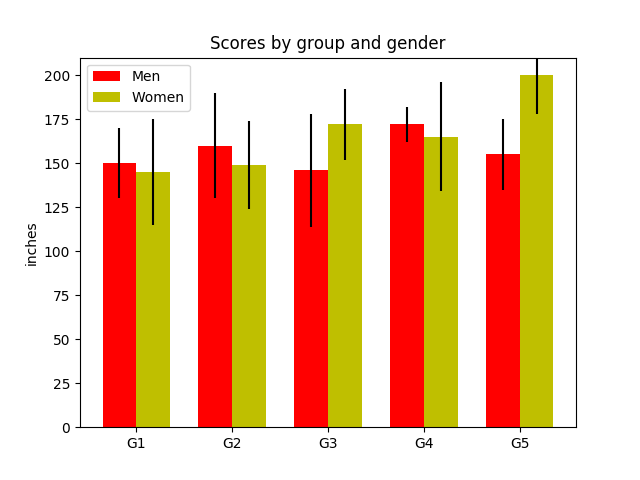
This is the same example as the barchart demo in centimeters.
This example requires basic_units.py
import numpy as np
from basic_units import cm, inch
import matplotlib.pyplot as plt


N = 5
menMeans = (150*cm, 160*cm, 146*cm, 172*cm, 155*cm)
menStd = (20*cm, 30*cm, 32*cm, 10*cm, 20*cm)

fig, ax = plt.subplots()

ind = np.arange(N)    # the x locations for the groups
width = 0.35         # the width of the bars
p1 = ax.bar(ind, menMeans, width, color='r', bottom=0*cm, yerr=menStd)


womenMeans = (145*cm, 149*cm, 172*cm, 165*cm, 200*cm)
womenStd = (30*cm, 25*cm, 20*cm, 31*cm, 22*cm)
p2 = ax.bar(ind + width, womenMeans, width,
            color='y', bottom=0*cm, yerr=womenStd)

ax.set_title('Scores by group and gender')
ax.set_xticks(ind + width / 2)
ax.set_xticklabels(('G1', 'G2', 'G3', 'G4', 'G5'))

ax.legend((p1[0], p2[0]), ('Men', 'Women'))
ax.yaxis.set_units(inch)
ax.autoscale_view()

plt.show()
Keywords: matplotlib code example, codex, python plot, pyplot Gallery generated by Sphinx-Gallery