Version 3.0.2
Several external packages that extend or build on Matplotlib functionality are listed below. They are maintained and distributed separately from Matplotlib and thus need to be installed individually.
Please submit an issue or pull request on Github if you have created a package that you would like to have included. We are also happy to host third party packages within the Matplotlib Github Organization.
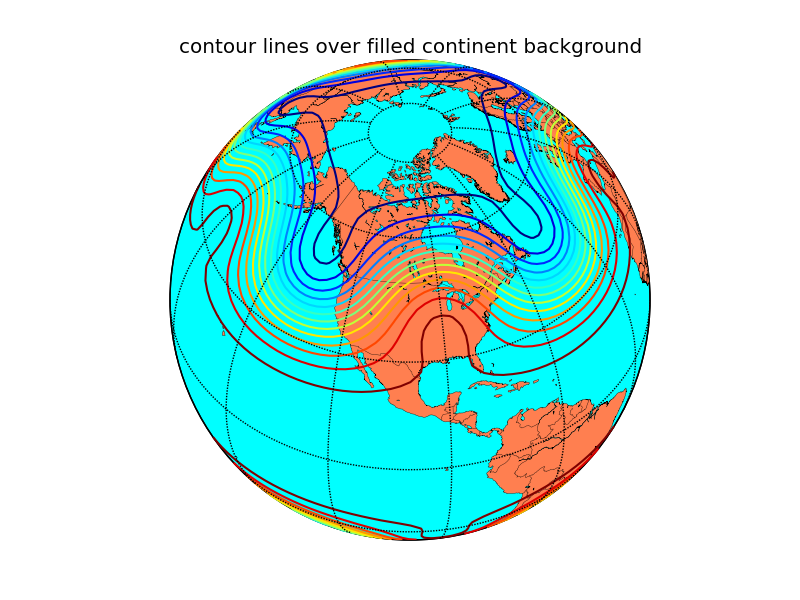
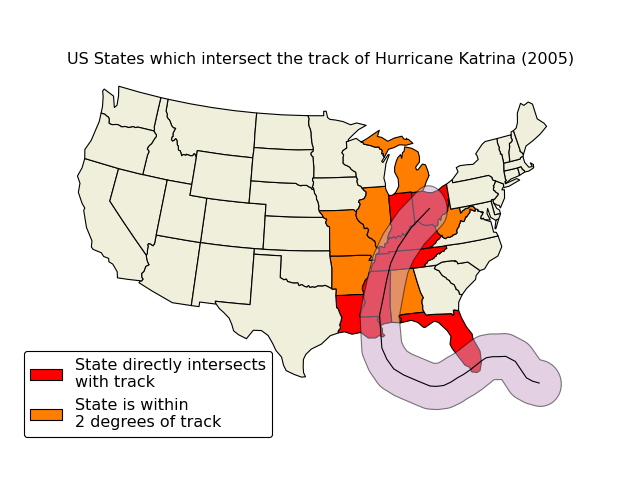
Cartopy builds on top of Matplotlib to provide object oriented map projection definitions and close integration with Shapely for powerful yet easy-to-use vector data processing tools. An example plot from the Cartopy gallery:
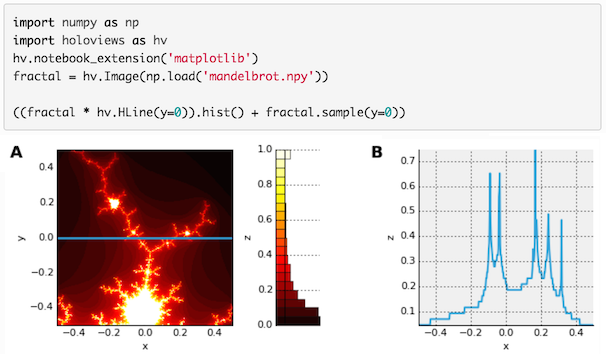
holoviews makes it easier to visualize data interactively, especially in a Jupyter notebook, by providing a set of declarative plotting objects that store your data and associated metadata. Your data is then immediately visualizable alongside or overlaid with other data, either statically or with automatically provided widgets for parameter exploration.
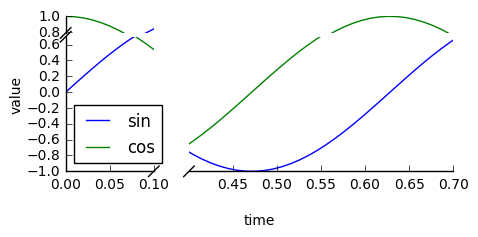
brokenaxes supplies an axes class that can have a visual break to indicate a discontinuous range.
DeCiDa is a library of functions and classes for electron device characterization, electronic circuit design and general data visualization and analysis.
Matplotlib-Venn provides a set of functions for plotting 2- and 3-set area-weighted (or unweighted) Venn diagrams.
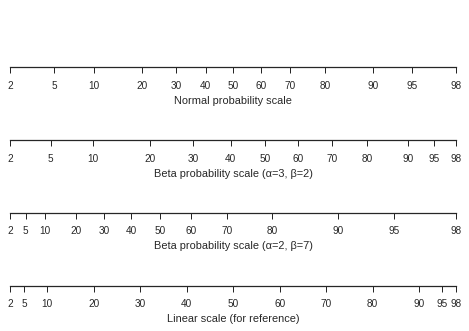
mpl-probscale is a small extension
that allows Matplotlib users to specify probabilty scales. Simply importing the
probscale module registers the scale with Matplotlib, making it accessible
via e.g., ax.set_xscale('prob') or plt.yscale('prob').
mpl-scatter-density is a small package that makes it easy to make scatter plots of large numbers of points using a density map. The following example contains around 13 million points and the plotting (excluding reading in the data) took less than a second on an average laptop:
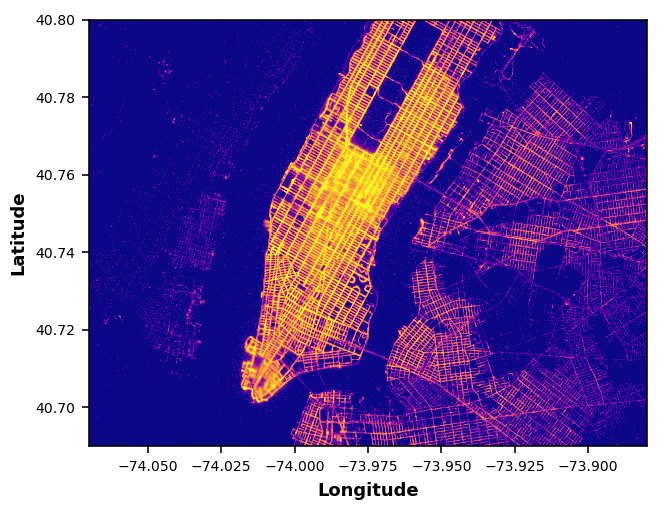
When used in interactive mode, the density map is downsampled on-the-fly while panning/zooming in order to provide a smooth interactive experience.
mplstereonet provides stereonets for plotting and analyzing orientation data in Matplotlib.
mpl_toolkits.natgrid is an interface to the natgrid C library for gridding irregularly spaced data.
pyUpSet is a static Python implementation of the UpSet suite by Lex et al. to explore complex intersections of sets and data frames.
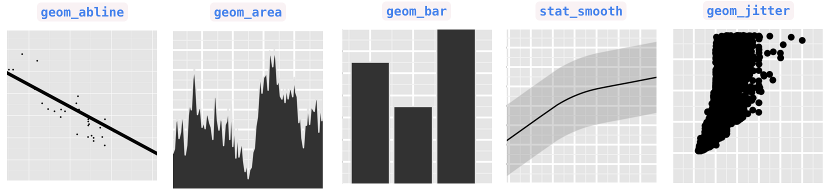
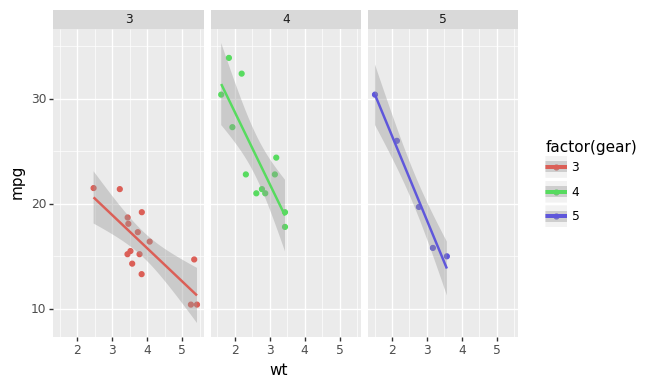
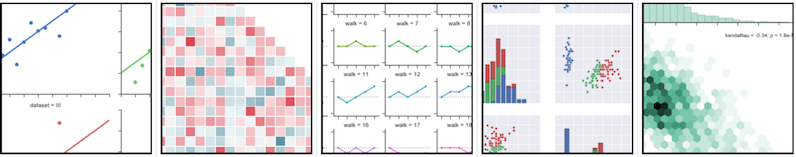
seaborn is a high level interface for drawing statistical graphics with Matplotlib. It aims to make visualization a central part of exploring and understanding complex datasets.
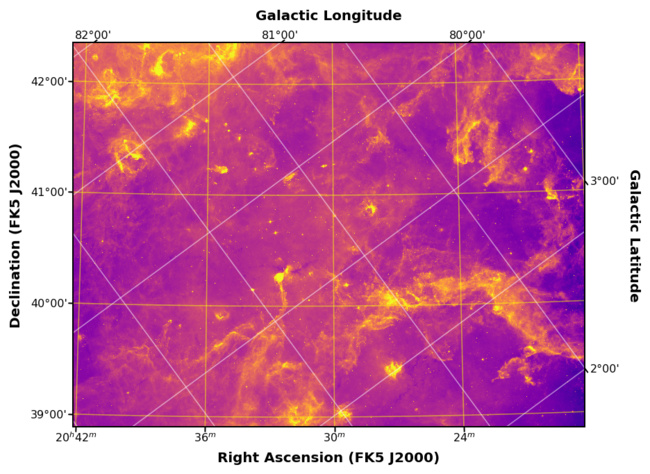
The Astropy core package includes a submodule called WCSAxes (available at astropy.visualization.wcsaxes) which adds Matplotlib projections for Astronomical image data. The following is an example of a plot made with WCSAxes which includes the original coordinate system of the image and an overlay of a different coordinate system:
mplcursors provides interactive data cursors for Matplotlib.
MplDataCursor is a toolkit written by Joe Kington to provide interactive "data cursors" (clickable annotation boxes) for Matplotlib.
adjustText is a small library for automatically adjusting text position in Matplotlib plots to minimize overlaps between them, specified points and other objects.
matplotlib_iterm2 is an external Matplotlib backend using the iTerm2 nightly build inline image display feature.
mplcairo is a cairo backend for Matplotlib, with faster and more accurate marker drawing, support for a wider selection of font formats and complex text layout, and various other features.
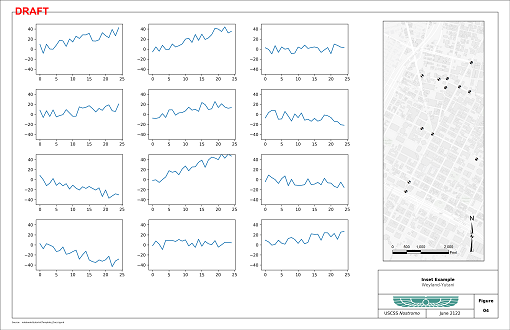
mpl-template provides a customizable way to add engineering figure elements such as a title block, border, and logo.