Version 3.0.2
Note
Click here to download the full example code
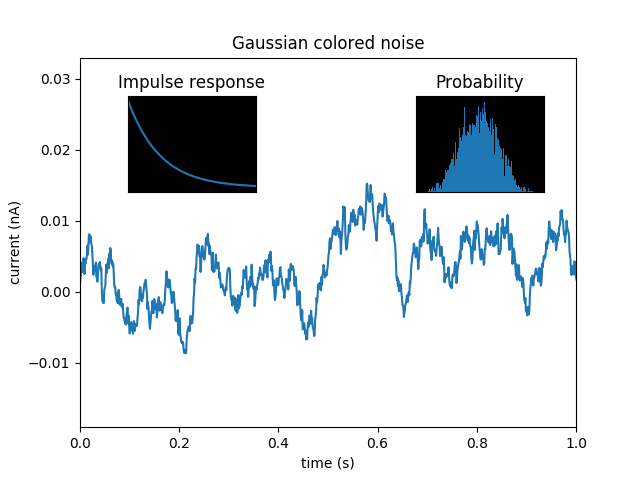
Example use of plt.axes to create inset axes within the main plot axes.
import matplotlib.pyplot as plt
import numpy as np

# Fixing random state for reproducibility
np.random.seed(19680801)


# create some data to use for the plot
dt = 0.001
t = np.arange(0.0, 10.0, dt)
r = np.exp(-t[:1000] / 0.05)  # impulse response
x = np.random.randn(len(t))
s = np.convolve(x, r)[:len(x)] * dt  # colored noise

# the main axes is subplot(111) by default
plt.plot(t, s)
plt.axis([0, 1, 1.1 * np.min(s), 2 * np.max(s)])
plt.xlabel('time (s)')
plt.ylabel('current (nA)')
plt.title('Gaussian colored noise')

# this is an inset axes over the main axes
a = plt.axes([.65, .6, .2, .2], facecolor='k')
n, bins, patches = plt.hist(s, 400, density=True)
plt.title('Probability')
plt.xticks([])
plt.yticks([])

# this is another inset axes over the main axes
a = plt.axes([0.2, 0.6, .2, .2], facecolor='k')
plt.plot(t[:len(r)], r)
plt.title('Impulse response')
plt.xlim(0, 0.2)
plt.xticks([])
plt.yticks([])

plt.show()
Keywords: matplotlib code example, codex, python plot, pyplot Gallery generated by Sphinx-Gallery