Version 3.0.2
matplotlib.pyplot.xticks(ticks=None, labels=None, **kwargs)[source]¶Get or set the current tick locations and labels of the x-axis.
Call signatures:
locs, labels = xticks()           # Get locations and labels

xticks(ticks, [labels], **kwargs)  # Set locations and labels
| Parameters: |
|
|---|---|
| Returns: |
|
Notes
Calling this function with no arguments (e.g. xticks()) is the pyplot
equivalent of calling get_xticks and get_xticklabels on
the current axes.
Calling this function with arguments is the pyplot equivalent of calling
set_xticks and set_xticklabels on the current axes.
Examples
Get the current locations and labels:
>>> locs, labels = xticks()
Set label locations:
>>> xticks(np.arange(0, 1, step=0.2))
Set text labels:
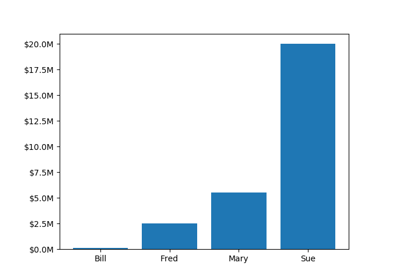
>>> xticks(np.arange(5), ('Tom', 'Dick', 'Harry', 'Sally', 'Sue'))
Set text labels and properties:
>>> xticks(np.arange(12), calendar.month_name[1:13], rotation=20)
Disable xticks:
>>> xticks([])
matplotlib.pyplot.xticks