Version 3.0.2
Note
Click here to download the full example code
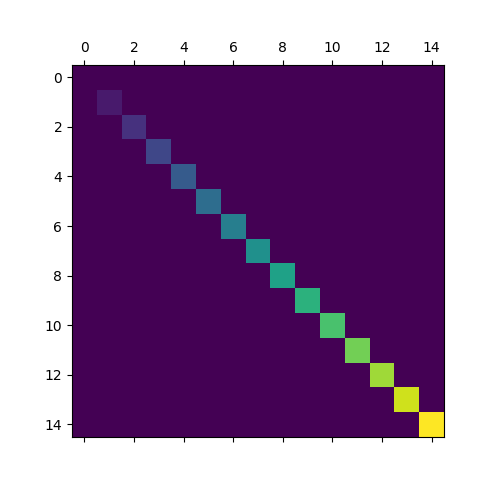
Simple matshow example.
import matplotlib.pyplot as plt
import numpy as np


def samplemat(dims):
    """Make a matrix with all zeros and increasing elements on the diagonal"""
    aa = np.zeros(dims)
    for i in range(min(dims)):
        aa[i, i] = i
    return aa


# Display matrix
plt.matshow(samplemat((15, 15)))

plt.show()
The use of the following functions and methods is shown in this example:
import matplotlib
matplotlib.axes.Axes.matshow
matplotlib.pyplot.matshow
Keywords: matplotlib code example, codex, python plot, pyplot Gallery generated by Sphinx-Gallery