You are reading an old version of the documentation (v3.0.2). For the latest version see https://matplotlib.org/stable/api/_as_gen/matplotlib.pyplot.matshow.html
Version 3.0.2
matplotlib
Fork me on GitHub

Table of Contents

matplotlib.pyplot.matshow

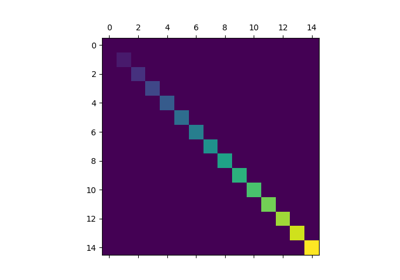
matplotlib.pyplot.matshow(A, fignum=None, **kwargs)[source]

Display an array as a matrix in a new figure window.

The origin is set at the upper left hand corner and rows (first dimension of the array) are displayed horizontally. The aspect ratio of the figure window is that of the array, unless this would make an excessively short or narrow figure.

Tick labels for the xaxis are placed on top.

Parameters:
A : array-like(M, N)

The matrix to be displayed.

fignum : None or int or False

If None, create a new figure window with automatic numbering.

If fignum is an integer, draw into the figure with the given number (create it if it does not exist).

If 0 or False, use the current axes if it exists instead of creating a new figure.

Note

Because of how Axes.matshow tries to set the figure aspect ratio to be the one of the array, strange things may happen if you reuse an existing figure.

Returns:
image : AxesImage
Other Parameters:
**kwargs : imshow arguments

Examples using matplotlib.pyplot.matshow