You are reading an old version of the documentation (v3.0.2). For the latest version see https://matplotlib.org/stable/api/_as_gen/matplotlib.pyplot.quiver.html
Version 3.0.2
matplotlib
Fork me on GitHub

Table of Contents

matplotlib.pyplot.quiver

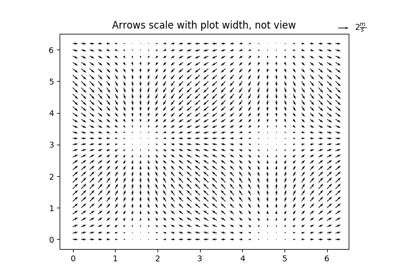
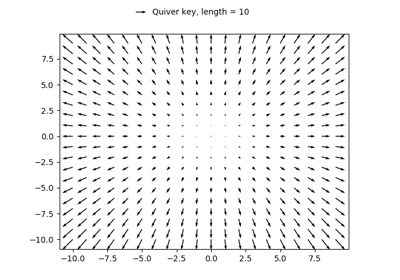
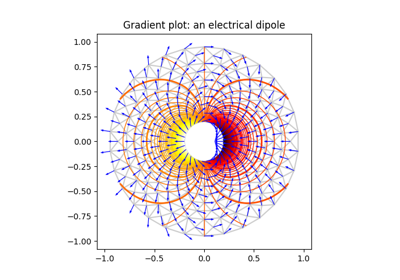
matplotlib.pyplot.quiver(*args, data=None, **kw)[source]

Plot a 2-D field of arrows.

Call signatures:

quiver(U, V, **kw)
quiver(U, V, C, **kw)
quiver(X, Y, U, V, **kw)
quiver(X, Y, U, V, C, **kw)

U and V are the arrow data, X and Y set the location of the arrows, and C sets the color of the arrows. These arguments may be 1-D or 2-D arrays or sequences.

If X and Y are absent, they will be generated as a uniform grid. If U and V are 2-D arrays and X and Y are 1-D, and if len(X) and len(Y) match the column and row dimensions of U, then X and Y will be expanded with numpy.meshgrid().

The default settings auto-scales the length of the arrows to a reasonable size. To change this behavior see the scale and scale_units kwargs.

The defaults give a slightly swept-back arrow; to make the head a triangle, make headaxislength the same as headlength. To make the arrow more pointed, reduce headwidth or increase headlength and headaxislength. To make the head smaller relative to the shaft, scale down all the head parameters. You will probably do best to leave minshaft alone.

linewidths and edgecolors can be used to customize the arrow outlines.

Parameters:
X : 1D or 2D array, sequence, optional

The x coordinates of the arrow locations

Y : 1D or 2D array, sequence, optional

The y coordinates of the arrow locations

U : 1D or 2D array or masked array, sequence

The x components of the arrow vectors

V : 1D or 2D array or masked array, sequence

The y components of the arrow vectors

C : 1D or 2D array, sequence, optional

The arrow colors

units : [ 'width' | 'height' | 'dots' | 'inches' | 'x' | 'y' | 'xy' ]

The arrow dimensions (except for length) are measured in multiples of this unit.

'width' or 'height': the width or height of the axis

'dots' or 'inches': pixels or inches, based on the figure dpi

'x', 'y', or 'xy': respectively X, Y, or \(\sqrt{X^2 + Y^2}\) in data units

The arrows scale differently depending on the units. For 'x' or 'y', the arrows get larger as one zooms in; for other units, the arrow size is independent of the zoom state. For 'width or 'height', the arrow size increases with the width and height of the axes, respectively, when the window is resized; for 'dots' or 'inches', resizing does not change the arrows.

angles : [ 'uv' | 'xy' ], array, optional

Method for determining the angle of the arrows. Default is 'uv'.

'uv': the arrow axis aspect ratio is 1 so that if U*==*V the orientation of the arrow on the plot is 45 degrees counter-clockwise from the horizontal axis (positive to the right).

'xy': arrows point from (x,y) to (x+u, y+v). Use this for plotting a gradient field, for example.

Alternatively, arbitrary angles may be specified as an array of values in degrees, counter-clockwise from the horizontal axis.

Note: inverting a data axis will correspondingly invert the arrows only with angles='xy'.

scale : None, float, optional

Number of data units per arrow length unit, e.g., m/s per plot width; a smaller scale parameter makes the arrow longer. Default is None.

If None, a simple autoscaling algorithm is used, based on the average vector length and the number of vectors. The arrow length unit is given by the scale_units parameter

scale_units : [ 'width' | 'height' | 'dots' | 'inches' | 'x' | 'y' | 'xy' ], None, optional

If the scale kwarg is None, the arrow length unit. Default is None.

e.g. scale_units is 'inches', scale is 2.0, and (u,v) = (1,0), then the vector will be 0.5 inches long.

If scale_units is 'width'/'height', then the vector will be half the width/height of the axes.

If scale_units is 'x' then the vector will be 0.5 x-axis units. To plot vectors in the x-y plane, with u and v having the same units as x and y, use angles='xy', scale_units='xy', scale=1.

width : scalar, optional

Shaft width in arrow units; default depends on choice of units, above, and number of vectors; a typical starting value is about 0.005 times the width of the plot.

headwidth : scalar, optional

Head width as multiple of shaft width, default is 3

headlength : scalar, optional

Head length as multiple of shaft width, default is 5

headaxislength : scalar, optional

Head length at shaft intersection, default is 4.5

minshaft : scalar, optional

Length below which arrow scales, in units of head length. Do not set this to less than 1, or small arrows will look terrible! Default is 1

minlength : scalar, optional

Minimum length as a multiple of shaft width; if an arrow length is less than this, plot a dot (hexagon) of this diameter instead. Default is 1.

pivot : [ 'tail' | 'mid' | 'middle' | 'tip' ], optional

The part of the arrow that is at the grid point; the arrow rotates about this point, hence the name pivot.

color : [ color | color sequence ], optional

This is a synonym for the PolyCollection facecolor kwarg. If C has been set, color has no effect.

See also

quiverkey
Add a key to a quiver plot

Notes

Additional PolyCollection keyword arguments:

Property Description
agg_filter a filter function, which takes a (m, n, 3) float array and a dpi value, and returns a (m, n, 3) array
alpha float or None
animated bool
antialiased bool or sequence of bools
array ndarray
capstyle {'butt', 'round', 'projecting'}
clim a length 2 sequence of floats; may be overridden in methods that have vmin and vmax kwargs.
clip_box Bbox
clip_on bool
clip_path [(Path, Transform) | Patch | None]
cmap colormap or registered colormap name
color matplotlib color arg or sequence of rgba tuples
contains callable
edgecolor color or sequence of colors
facecolor color or sequence of colors
figure Figure
gid str
hatch {'/', '\', '|', '-', '+', 'x', 'o', 'O', '.', '*'}
in_layout bool
joinstyle {'miter', 'round', 'bevel'}
label object
linestyle {'-', '--', '-.', ':', '', (offset, on-off-seq), ...}
linewidth float or sequence of floats
norm Normalize
offset_position {'screen', 'data'}
offsets float or sequence of floats
path_effects AbstractPathEffect
picker None or bool or float or callable
pickradius unknown
rasterized bool or None
sketch_params (scale: float, length: float, randomness: float)
snap bool or None
transform Transform
url str
urls List[str] or None
visible bool
zorder float