You are reading an old version of the documentation (v3.0.2). For the latest version see https://matplotlib.org/stable/api/_as_gen/matplotlib.colors.PowerNorm.html
Version 3.0.2
matplotlib
Fork me on GitHub

Table of Contents

matplotlib.colors.PowerNorm

class matplotlib.colors.PowerNorm(gamma, vmin=None, vmax=None, clip=False)[source]

Bases: matplotlib.colors.Normalize

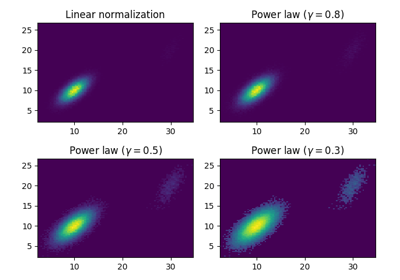
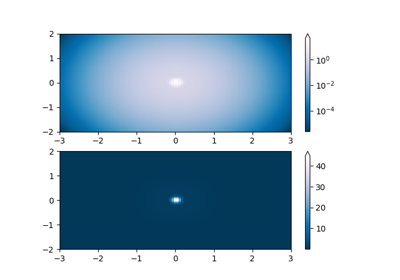
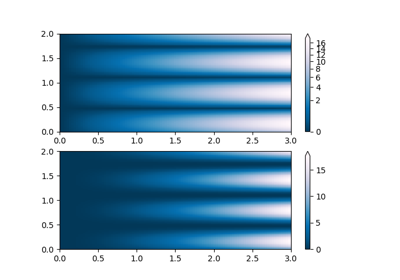
Linearly map a given value to the 0-1 range and then apply a power-law normalization over that range.

autoscale(A)[source]

Set vmin, vmax to min, max of A.

autoscale_None(A)[source]

autoscale only None-valued vmin or vmax.

inverse(value)[source]