Version 3.0.0
Note
Click here to download the full example code
Reference for filled-, unfilled- and custom marker types with Matplotlib.
For a list of all markers see the matplotlib.markers documentation. Also
refer to the Marker filling-styles
and Marker Path examples.
import numpy as np
import matplotlib.pyplot as plt
from matplotlib.lines import Line2D


points = np.ones(3)  # Draw 3 points for each line
text_style = dict(horizontalalignment='right', verticalalignment='center',
                  fontsize=12, fontdict={'family': 'monospace'})
marker_style = dict(linestyle=':', color='0.8', markersize=10,
                    mfc="C0", mec="C0")


def format_axes(ax):
    ax.margins(0.2)
    ax.set_axis_off()
    ax.invert_yaxis()


def nice_repr(text):
    return repr(text).lstrip('u')


def math_repr(text):
    tx = repr(text).lstrip('u').strip("'").strip("$")
    return r"'\${}\$'".format(tx)


def split_list(a_list):
    i_half = len(a_list) // 2
    return (a_list[:i_half], a_list[i_half:])
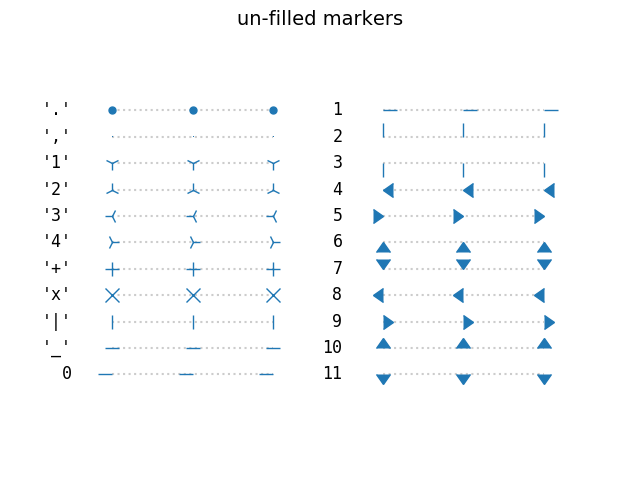
Plot all un-filled markers
fig, axes = plt.subplots(ncols=2)
fig.suptitle('un-filled markers', fontsize=14)

# Filter out filled markers and marker settings that do nothing.
unfilled_markers = [m for m, func in Line2D.markers.items()
                    if func != 'nothing' and m not in Line2D.filled_markers]

for ax, markers in zip(axes, split_list(unfilled_markers)):
    for y, marker in enumerate(markers):
        ax.text(-0.5, y, nice_repr(marker), **text_style)
        ax.plot(y * points, marker=marker, **marker_style)
        format_axes(ax)

plt.show()
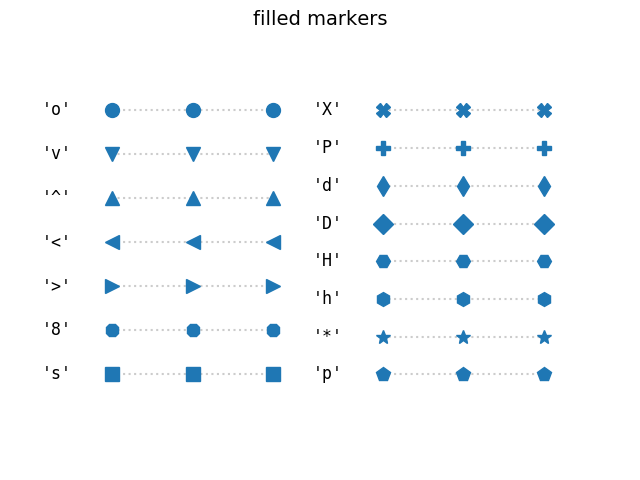
Plot all filled markers.
fig, axes = plt.subplots(ncols=2)
for ax, markers in zip(axes, split_list(Line2D.filled_markers)):
    for y, marker in enumerate(markers):
        ax.text(-0.5, y, nice_repr(marker), **text_style)
        ax.plot(y * points, marker=marker, **marker_style)
        format_axes(ax)
fig.suptitle('filled markers', fontsize=14)

plt.show()
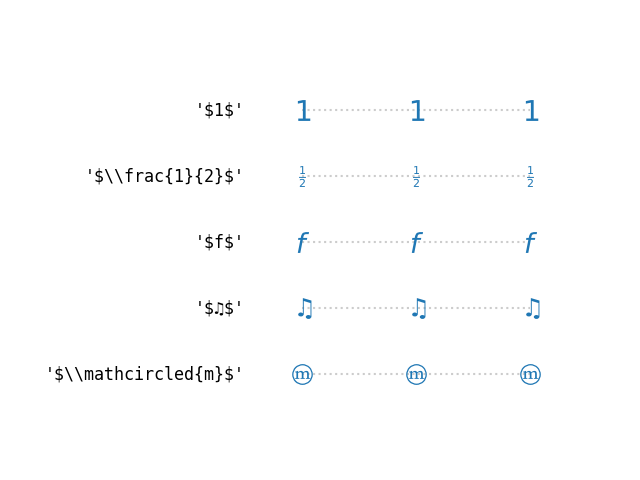
Use MathText, to use custom marker symbols,
like e.g. "$\u266B$". For an overview over the STIX font symbols refer
to the STIX font table.
Also see the STIX Fonts Demo.
fig, ax = plt.subplots()
fig.subplots_adjust(left=0.4)

marker_style.update(mec="None", markersize=15)
markers = ["$1$", r"$\frac{1}{2}$", "$f$", "$\u266B$",
           r"$\mathcircled{m}$"]


for y, marker in enumerate(markers):
    ax.text(-0.5, y, math_repr(marker), **text_style)
    ax.plot(y * points, marker=marker, **marker_style)
format_axes(ax)

plt.show()
Keywords: matplotlib code example, codex, python plot, pyplot Gallery generated by Sphinx-Gallery