Version 3.0.0
Note
Click here to download the full example code
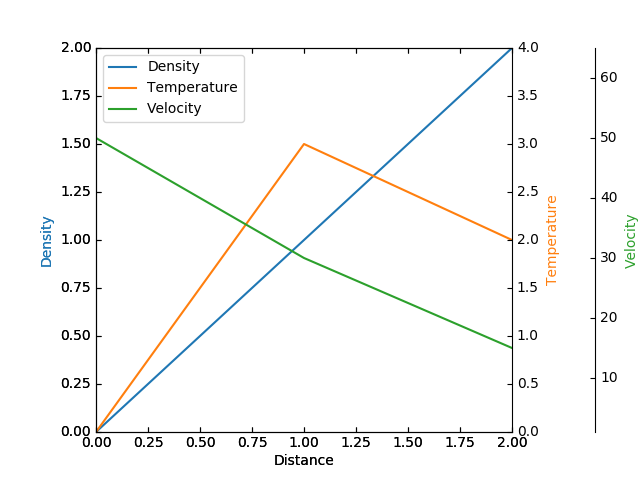
Create a parasite axes. Such axes would share the x scale with a host axes, but show a different scale in y direction.
Note that this approach uses the parasite_axes'
HostAxes and
ParasiteAxes. An alternative
approach using the Matplotlib axes_grid1 Toolkit and
Matplotlib axisartist Toolkit
is found in the Demo Parasite Axes2 example.
An alternative approach using the usual matplotlib subplots is shown in
the Multiple Yaxis With Spines example.
from mpl_toolkits.axisartist.parasite_axes import HostAxes, ParasiteAxes
import matplotlib.pyplot as plt


fig = plt.figure(1)

host = HostAxes(fig, [0.15, 0.1, 0.65, 0.8])
par1 = ParasiteAxes(host, sharex=host)
par2 = ParasiteAxes(host, sharex=host)
host.parasites.append(par1)
host.parasites.append(par2)

host.set_ylabel("Density")
host.set_xlabel("Distance")

host.axis["right"].set_visible(False)
par1.axis["right"].set_visible(True)
par1.set_ylabel("Temperature")

par1.axis["right"].major_ticklabels.set_visible(True)
par1.axis["right"].label.set_visible(True)

par2.set_ylabel("Velocity")
offset = (60, 0)
new_axisline = par2._grid_helper.new_fixed_axis
par2.axis["right2"] = new_axisline(loc="right", axes=par2, offset=offset)

fig.add_axes(host)

host.set_xlim(0, 2)
host.set_ylim(0, 2)

host.set_xlabel("Distance")
host.set_ylabel("Density")
par1.set_ylabel("Temperature")

p1, = host.plot([0, 1, 2], [0, 1, 2], label="Density")
p2, = par1.plot([0, 1, 2], [0, 3, 2], label="Temperature")
p3, = par2.plot([0, 1, 2], [50, 30, 15], label="Velocity")

par1.set_ylim(0, 4)
par2.set_ylim(1, 65)

host.legend()

host.axis["left"].label.set_color(p1.get_color())
par1.axis["right"].label.set_color(p2.get_color())
par2.axis["right2"].label.set_color(p3.get_color())

plt.show()
Keywords: matplotlib code example, codex, python plot, pyplot Gallery generated by Sphinx-Gallery