Version 3.0.0
Note
Click here to download the full example code
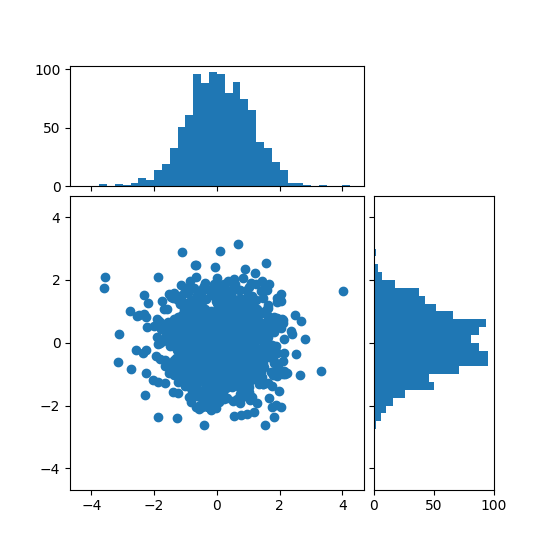
import numpy as np
import matplotlib.pyplot as plt
from mpl_toolkits.axes_grid1 import make_axes_locatable

# Fixing random state for reproducibility
np.random.seed(19680801)


# the random data
x = np.random.randn(1000)
y = np.random.randn(1000)


fig, axScatter = plt.subplots(figsize=(5.5, 5.5))

# the scatter plot:
axScatter.scatter(x, y)
axScatter.set_aspect(1.)

# create new axes on the right and on the top of the current axes
# The first argument of the new_vertical(new_horizontal) method is
# the height (width) of the axes to be created in inches.
divider = make_axes_locatable(axScatter)
axHistx = divider.append_axes("top", 1.2, pad=0.1, sharex=axScatter)
axHisty = divider.append_axes("right", 1.2, pad=0.1, sharey=axScatter)

# make some labels invisible
axHistx.xaxis.set_tick_params(labelbottom=False)
axHisty.yaxis.set_tick_params(labelleft=False)

# now determine nice limits by hand:
binwidth = 0.25
xymax = max(np.max(np.abs(x)), np.max(np.abs(y)))
lim = (int(xymax/binwidth) + 1)*binwidth

bins = np.arange(-lim, lim + binwidth, binwidth)
axHistx.hist(x, bins=bins)
axHisty.hist(y, bins=bins, orientation='horizontal')

# the xaxis of axHistx and yaxis of axHisty are shared with axScatter,
# thus there is no need to manually adjust the xlim and ylim of these
# axis.

axHistx.set_yticks([0, 50, 100])

axHisty.set_xticks([0, 50, 100])

plt.show()
Keywords: matplotlib code example, codex, python plot, pyplot Gallery generated by Sphinx-Gallery