Version 2.2.5
Note
Click here to download the full example code
Example boxplot code
import numpy as np
import matplotlib.pyplot as plt

# Fixing random state for reproducibility
np.random.seed(19680801)

# fake up some data
spread = np.random.rand(50) * 100
center = np.ones(25) * 50
flier_high = np.random.rand(10) * 100 + 100
flier_low = np.random.rand(10) * -100
data = np.concatenate((spread, center, flier_high, flier_low), 0)
fig1, ax1 = plt.subplots()
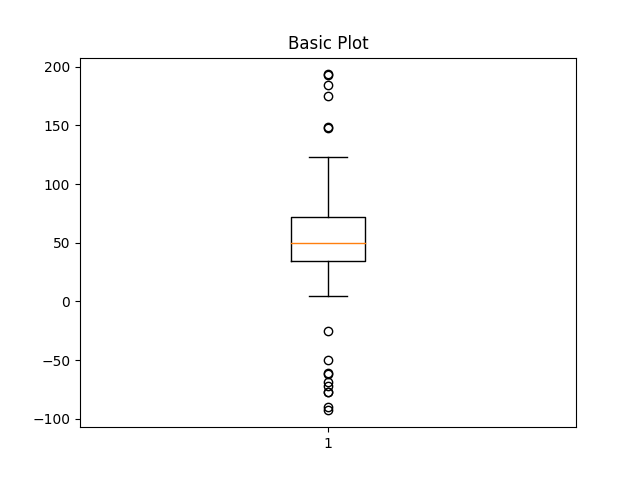
ax1.set_title('Basic Plot')
ax1.boxplot(data)
Out:
{'whiskers': [<matplotlib.lines.Line2D object at 0x7fd73c21e910>, <matplotlib.lines.Line2D object at 0x7fd73c21e700>], 'caps': [<matplotlib.lines.Line2D object at 0x7fd73c214640>, <matplotlib.lines.Line2D object at 0x7fd73c2141f0>], 'boxes': [<matplotlib.lines.Line2D object at 0x7fd73c21e730>], 'medians': [<matplotlib.lines.Line2D object at 0x7fd73c214f10>], 'fliers': [<matplotlib.lines.Line2D object at 0x7fd73c21e5e0>], 'means': []}
fig2, ax2 = plt.subplots()
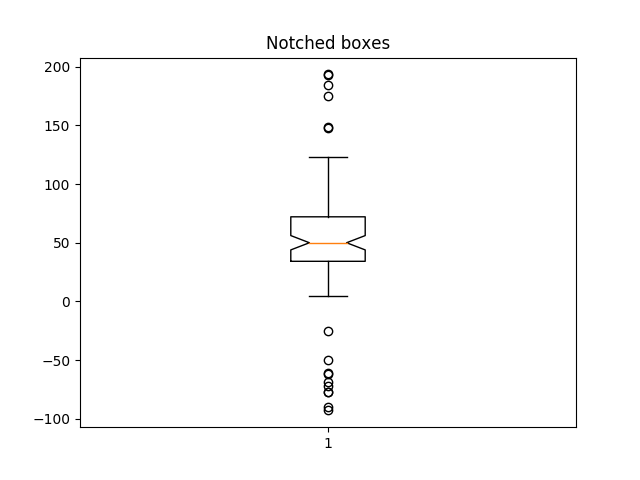
ax2.set_title('Notched boxes')
ax2.boxplot(data, notch=True)
Out:
{'whiskers': [<matplotlib.lines.Line2D object at 0x7fd73c27a340>, <matplotlib.lines.Line2D object at 0x7fd73c27ac40>], 'caps': [<matplotlib.lines.Line2D object at 0x7fd73c27aa90>, <matplotlib.lines.Line2D object at 0x7fd73c27aac0>], 'boxes': [<matplotlib.lines.Line2D object at 0x7fd73c27ae50>], 'medians': [<matplotlib.lines.Line2D object at 0x7fd73c3f3190>], 'fliers': [<matplotlib.lines.Line2D object at 0x7fd73c27ad00>], 'means': []}
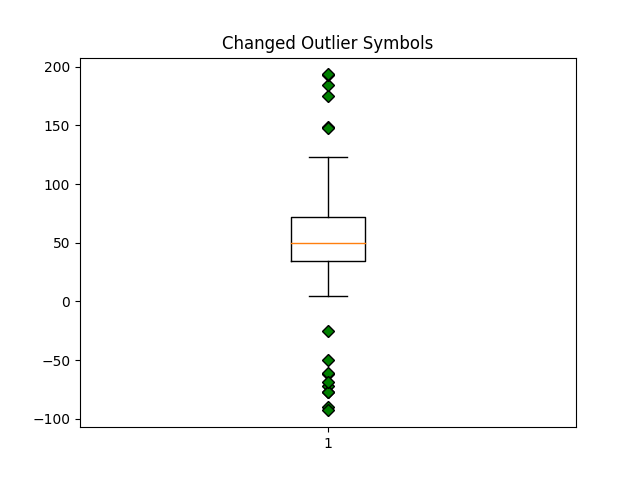
green_diamond = dict(markerfacecolor='g', marker='D')
fig3, ax3 = plt.subplots()
ax3.set_title('Changed Outlier Symbols')
ax3.boxplot(data, flierprops=green_diamond)
Out:
{'whiskers': [<matplotlib.lines.Line2D object at 0x7fd73c2d1eb0>, <matplotlib.lines.Line2D object at 0x7fd73c2d1580>], 'caps': [<matplotlib.lines.Line2D object at 0x7fd73c2d1dc0>, <matplotlib.lines.Line2D object at 0x7fd73c2d10a0>], 'boxes': [<matplotlib.lines.Line2D object at 0x7fd73c2d1130>], 'medians': [<matplotlib.lines.Line2D object at 0x7fd73c31e190>], 'fliers': [<matplotlib.lines.Line2D object at 0x7fd73c2d1fd0>], 'means': []}
fig4, ax4 = plt.subplots()
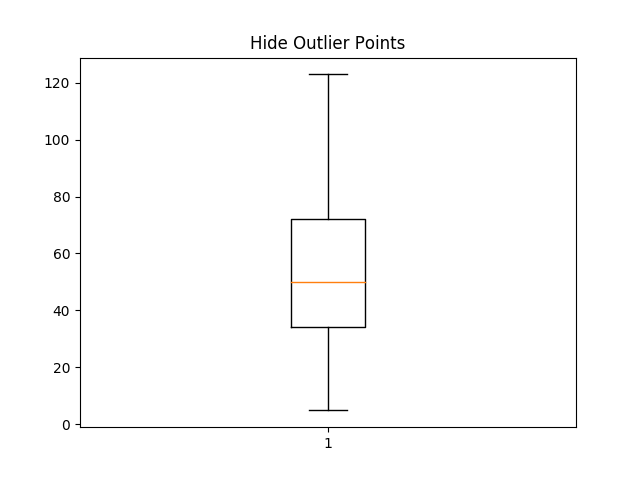
ax4.set_title('Hide Outlier Points')
ax4.boxplot(data, showfliers=False)
Out:
{'whiskers': [<matplotlib.lines.Line2D object at 0x7fd73ca13400>, <matplotlib.lines.Line2D object at 0x7fd73ca13820>], 'caps': [<matplotlib.lines.Line2D object at 0x7fd73ca13880>, <matplotlib.lines.Line2D object at 0x7fd73c3264c0>], 'boxes': [<matplotlib.lines.Line2D object at 0x7fd73ca13c70>], 'medians': [<matplotlib.lines.Line2D object at 0x7fd73c326910>], 'fliers': [], 'means': []}
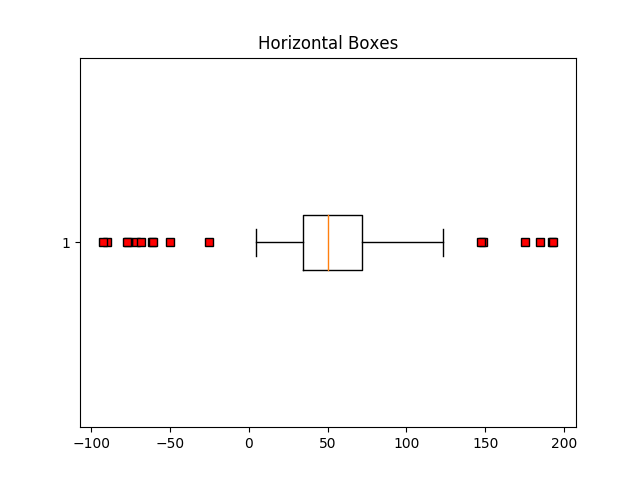
red_square = dict(markerfacecolor='r', marker='s')
fig5, ax5 = plt.subplots()
ax5.set_title('Horizontal Boxes')
ax5.boxplot(data, vert=False, flierprops=red_square)
Out:
{'whiskers': [<matplotlib.lines.Line2D object at 0x7fd73c456100>, <matplotlib.lines.Line2D object at 0x7fd73c9f9b50>], 'caps': [<matplotlib.lines.Line2D object at 0x7fd73f300eb0>, <matplotlib.lines.Line2D object at 0x7fd73c450cd0>], 'boxes': [<matplotlib.lines.Line2D object at 0x7fd73c456b50>], 'medians': [<matplotlib.lines.Line2D object at 0x7fd73c977e50>], 'fliers': [<matplotlib.lines.Line2D object at 0x7fd73c456a60>], 'means': []}
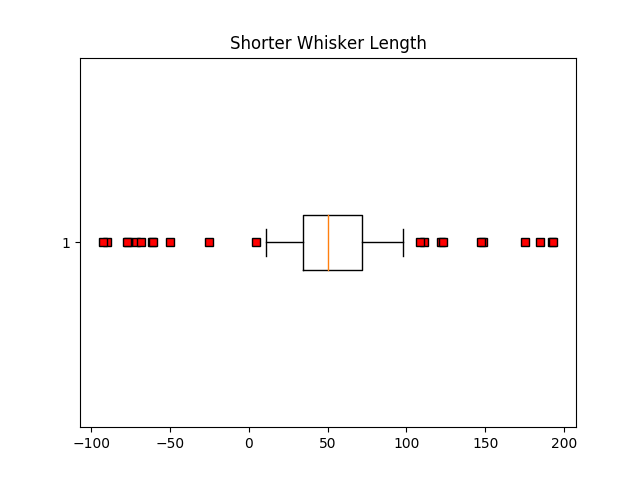
fig6, ax6 = plt.subplots()
ax6.set_title('Shorter Whisker Length')
ax6.boxplot(data, flierprops=red_square, vert=False, whis=0.75)
Out:
{'whiskers': [<matplotlib.lines.Line2D object at 0x7fd73c364eb0>, <matplotlib.lines.Line2D object at 0x7fd73c3649a0>], 'caps': [<matplotlib.lines.Line2D object at 0x7fd73c3447c0>, <matplotlib.lines.Line2D object at 0x7fd73c344c10>], 'boxes': [<matplotlib.lines.Line2D object at 0x7fd73c3649d0>], 'medians': [<matplotlib.lines.Line2D object at 0x7fd73c344370>], 'fliers': [<matplotlib.lines.Line2D object at 0x7fd73c364970>], 'means': []}
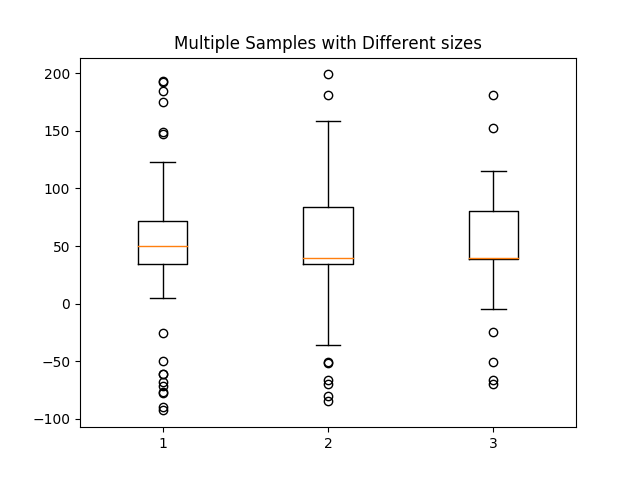
Fake up some more data
spread = np.random.rand(50) * 100
center = np.ones(25) * 40
flier_high = np.random.rand(10) * 100 + 100
flier_low = np.random.rand(10) * -100
d2 = np.concatenate((spread, center, flier_high, flier_low), 0)
data.shape = (-1, 1)
d2.shape = (-1, 1)
Making a 2-D array only works if all the columns are the same length. If they are not, then use a list instead. This is actually more efficient because boxplot converts a 2-D array into a list of vectors internally anyway.
Keywords: matplotlib code example, codex, python plot, pyplot Gallery generated by Sphinx-Gallery