Version 2.2.5
matplotlib.patches.ConnectionPatch(xyA, xyB, coordsA, coordsB=None, axesA=None, axesB=None, arrowstyle='-', arrow_transmuter=None, connectionstyle='arc3', connector=None, patchA=None, patchB=None, shrinkA=0.0, shrinkB=0.0, mutation_scale=10.0, mutation_aspect=None, clip_on=False, dpi_cor=1.0, **kwargs)[source]¶A ConnectionPatch class is to make
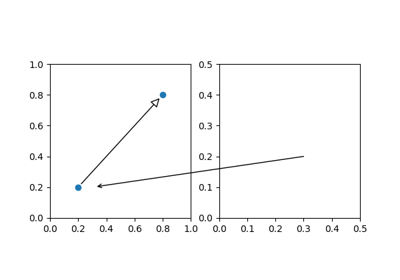
connecting lines between two points (possibly in different axes).
Connect point xyA in coordsA with point xyB in coordsB
Valid keys are
| Key | Description |
|---|---|
| arrowstyle | the arrow style |
| connectionstyle | the connection style |
| relpos | default is (0.5, 0.5) |
| patchA | default is bounding box of the text |
| patchB | default is None |
| shrinkA | default is 2 points |
| shrinkB | default is 2 points |
| mutation_scale | default is text size (in points) |
| mutation_aspect | default is 1. |
| ? | any key for matplotlib.patches.PathPatch |
coordsA and coordsB are strings that indicate the coordinates of xyA and xyB.
| Property | Description |
|---|---|
| 'figure points' | points from the lower left corner of the figure |
| 'figure pixels' | pixels from the lower left corner of the figure |
| 'figure fraction' | 0,0 is lower left of figure and 1,1 is upper, right |
| 'axes points' | points from lower left corner of axes |
| 'axes pixels' | pixels from lower left corner of axes |
| 'axes fraction' | 0,1 is lower left of axes and 1,1 is upper right |
| 'data' | use the coordinate system of the object being annotated (default) |
| 'offset points' | Specify an offset (in points) from the xy value |
| 'polar' | you can specify theta, r for the annotation, even in cartesian plots. Note that if you are using a polar axes, you do not need to specify polar for the coordinate system since that is the native "data" coordinate system. |
get_annotation_clip()[source]¶Return annotation_clip attribute.
See set_annotation_clip() for the meaning of return values.
matplotlib.patches.ConnectionPatch