Axes
matplotlib.axes.Axes.set_yticks
Axes.
set_yticks
Set the y ticks with list of ticks
List of y-axis tick locations
If False sets major ticks, if True sets minor ticks. Default is False.
False
True
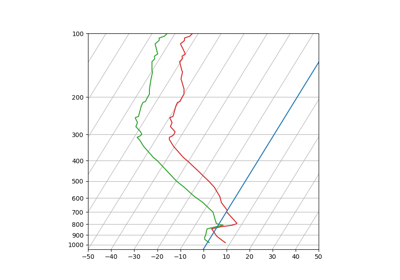
SkewT-logP diagram: using transforms and custom projections
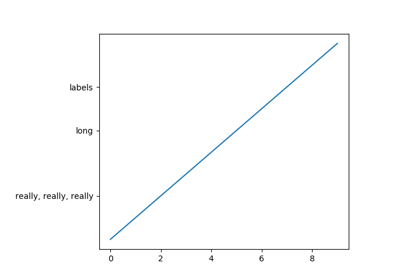
Auto Subplots Adjust
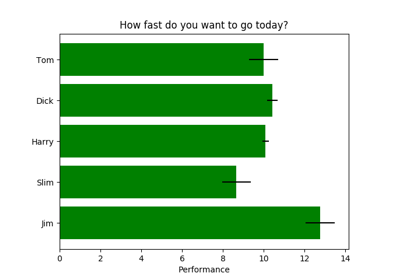
Horizontal bar chart
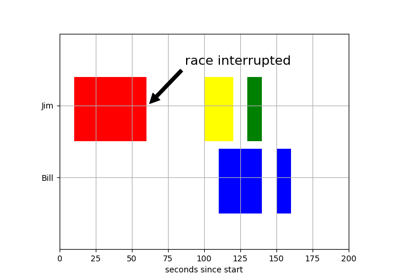
Broken Barh
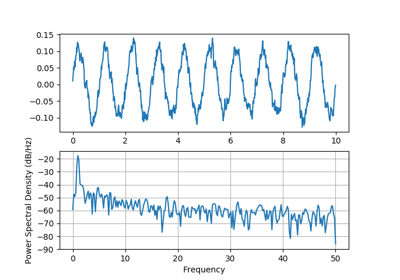
Psd Demo
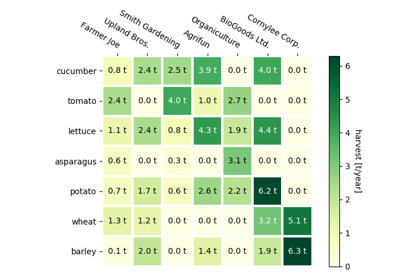
Creating annotated heatmaps
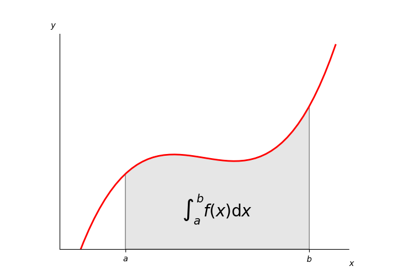
Integral as the area under a curve
Shaded & power normalized rendering
Firefox
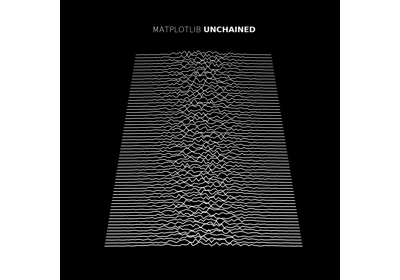
MATPLOTLIB UNCHAINED
Rain simulation
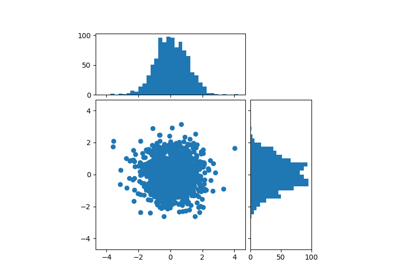
Scatter Hist
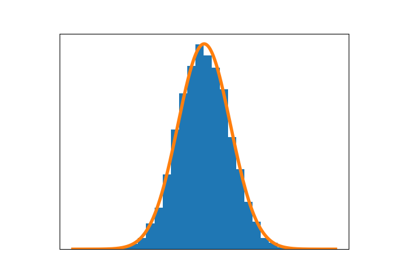
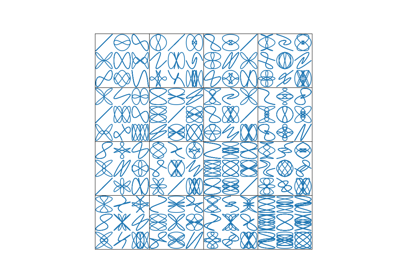
Frontpage histogram example
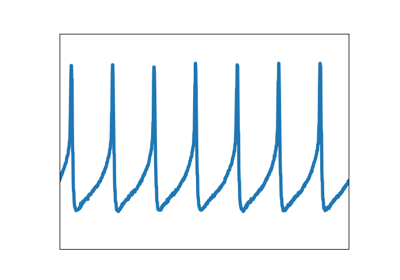
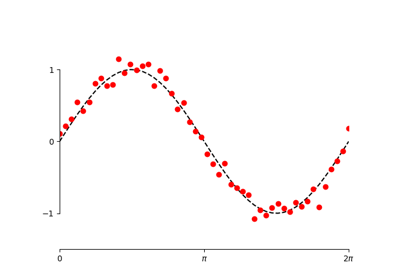
Frontpage plot example
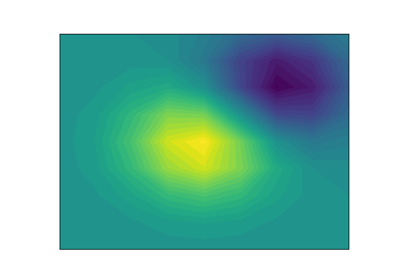
Frontpage contour example
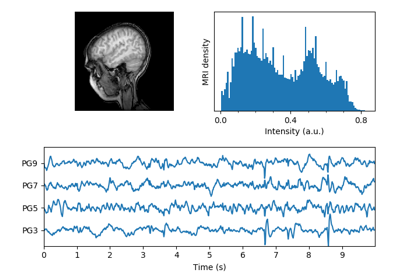
MRI With EEG
Custom spine bounds
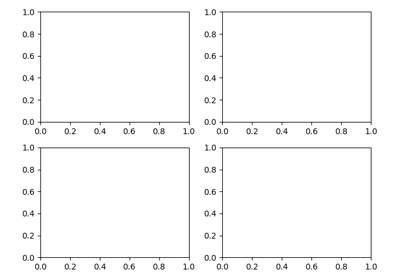
Demo Gridspec06
Customizing Figure Layouts Using GridSpec and Other Functions