Axes
matplotlib.axes.Axes.set_xticks
Axes.
set_xticks
Set the x ticks with list of ticks
List of x-axis tick locations.
If False sets major ticks, if True sets minor ticks. Default is False.
False
True
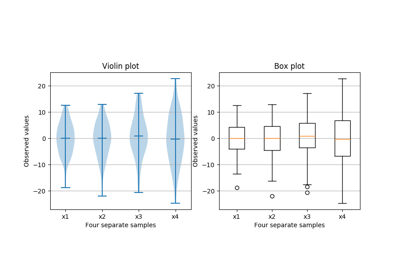
Box plot vs. violin plot comparison
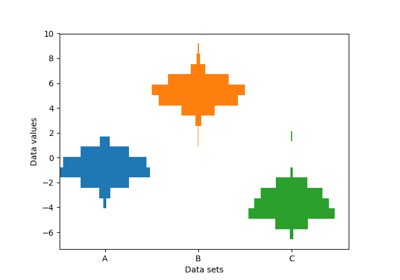
Producing multiple histograms side by side
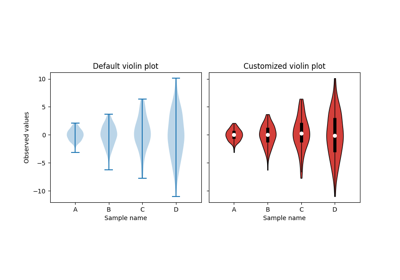
Violin plot customization
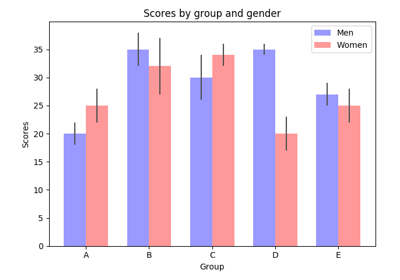
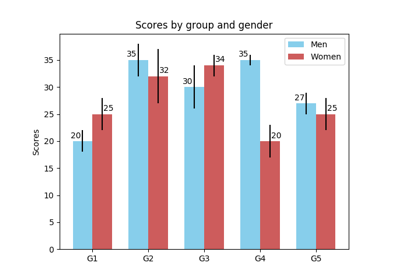
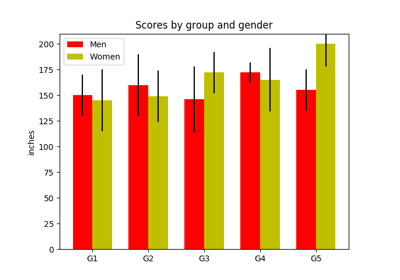
Barchart Demo
Barchart
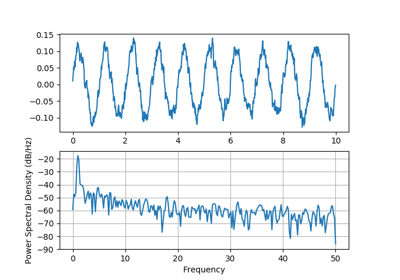
Psd Demo
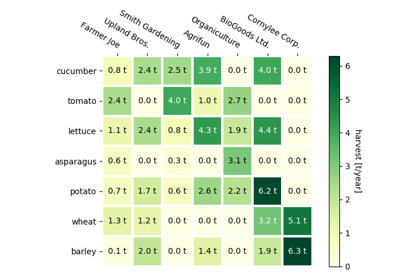
Creating annotated heatmaps
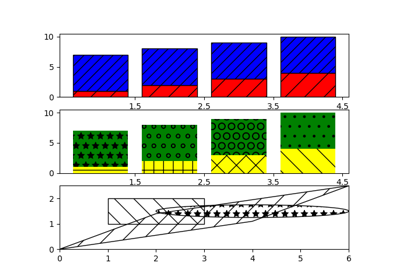
Hatch Demo
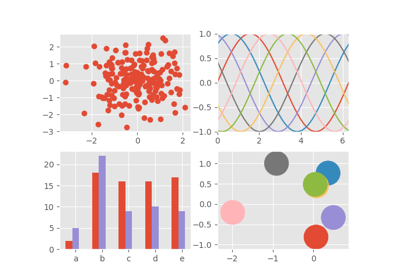
ggplot style sheet
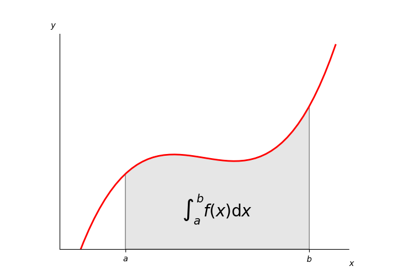
Integral as the area under a curve
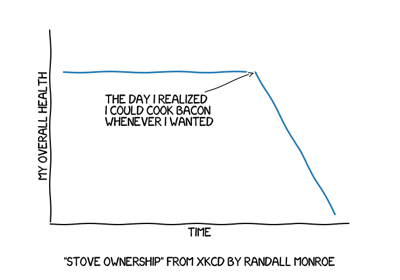
XKCD
Shaded & power normalized rendering
Firefox
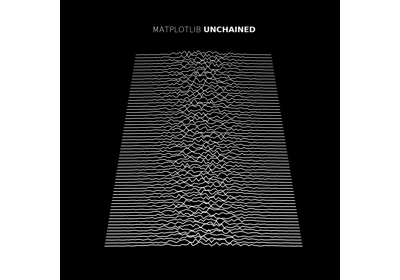
MATPLOTLIB UNCHAINED
Rain simulation
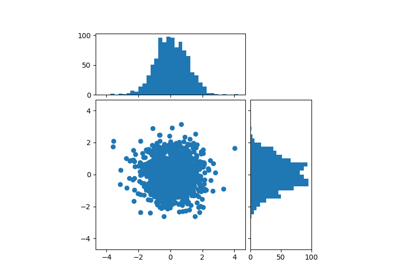
Scatter Hist
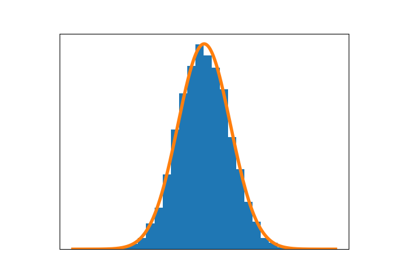
Frontpage histogram example
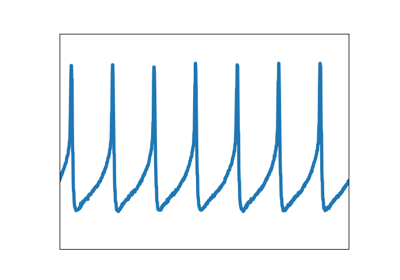
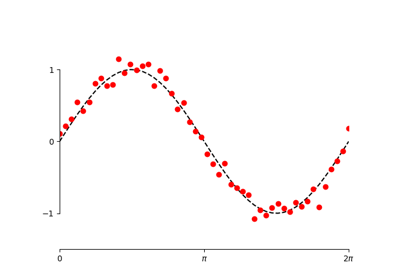
Frontpage plot example
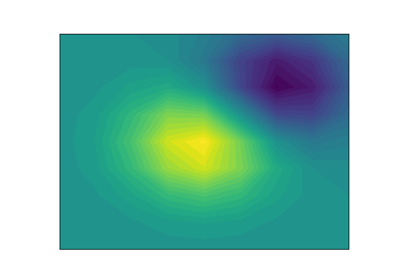
Frontpage contour example
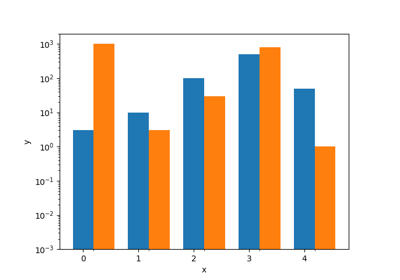
Log Bar
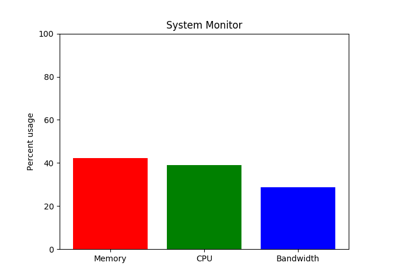
System Monitor
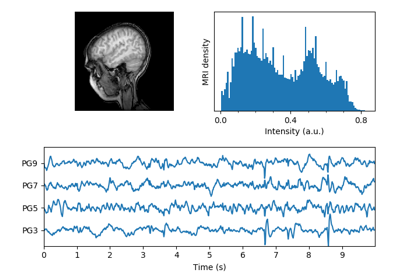
MRI With EEG
Custom spine bounds
Group barchart with units
Demo Gridspec06
The Lifecycle of a Plot
Customizing Figure Layouts Using GridSpec and Other Functions