Axes
matplotlib.axes.Axes.set_xlabel
Axes.
set_xlabel
Set the label for the x-axis.
The label text.
Spacing in points between the label and the x-axis.
Text
Text properties control the appearance of the label.
See also
text
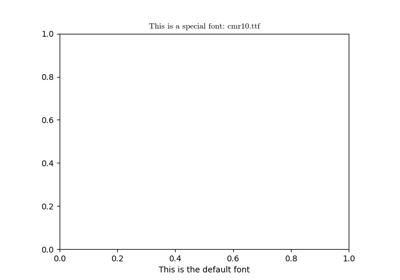
Using a ttf font file in Matplotlib
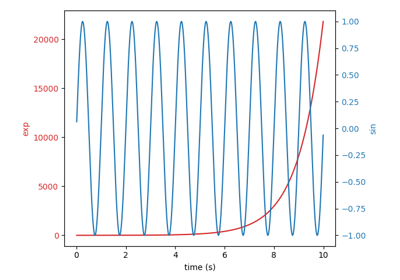
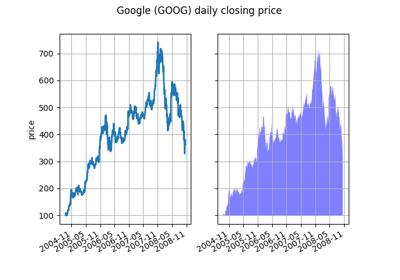
Plots with different scales
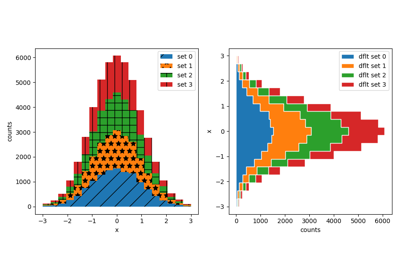
Hatch-filled histograms
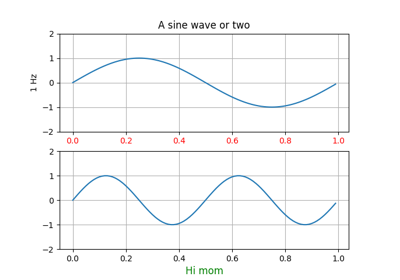
Fig Axes Labels Simple
Text Commands
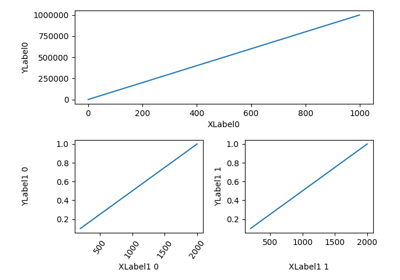
Aligning Labels
Demo Tight Layout
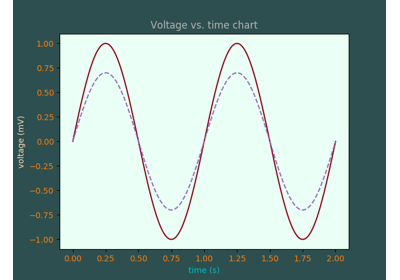
Color Demo
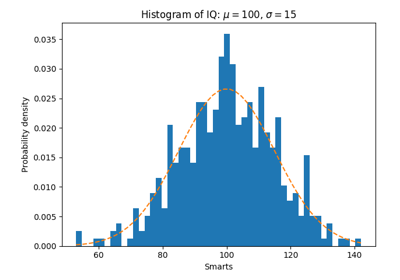
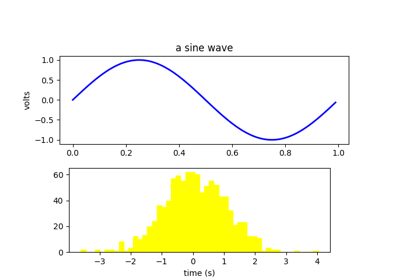
Demo of the histogram (hist) function with a few features
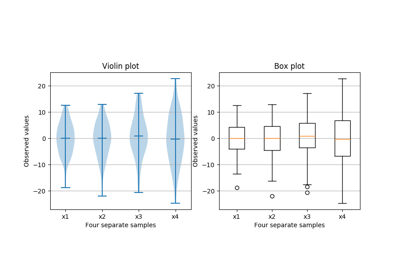
Box plot vs. violin plot comparison
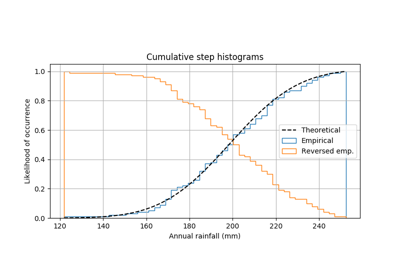
Using histograms to plot a cumulative distribution
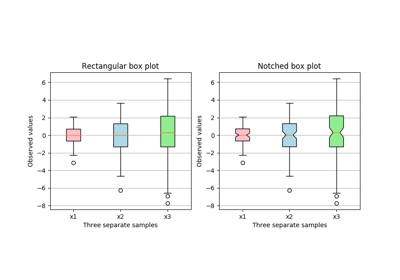
Box plots with custom fill colors
Producing multiple histograms side by side
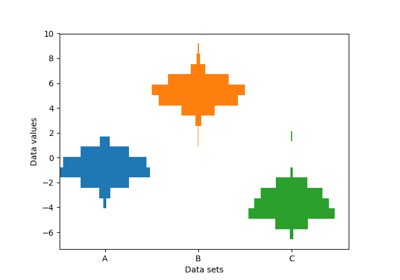
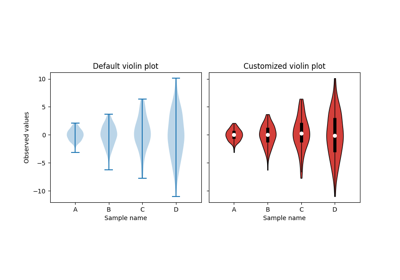
Violin plot customization
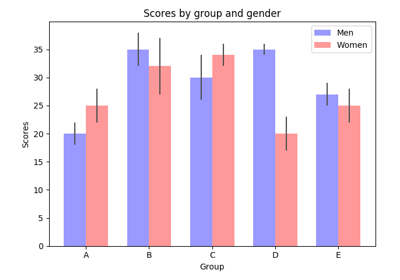
Barchart Demo
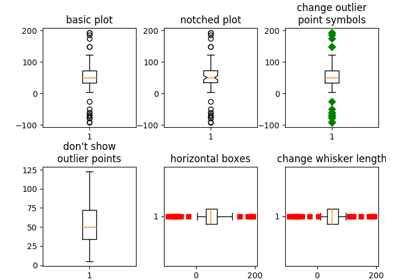
Boxplots
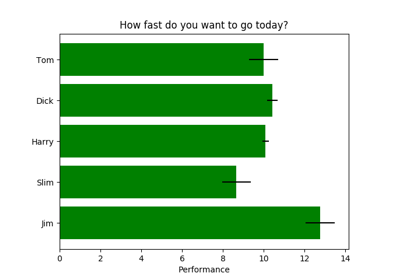
Horizontal bar chart
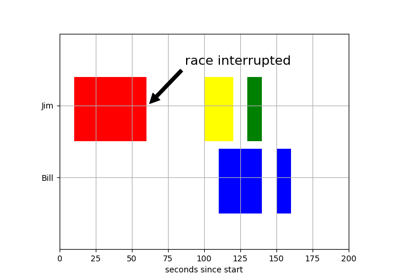
Broken Barh
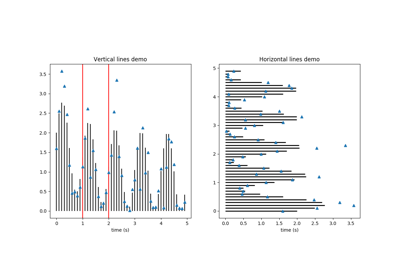
hlines and vlines
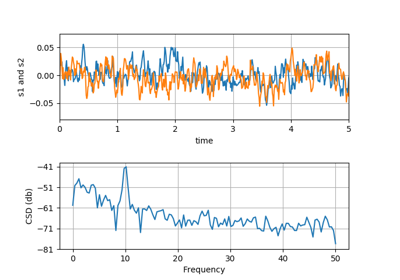
CSD Demo
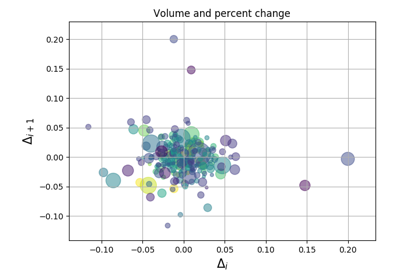
Scatter Demo2
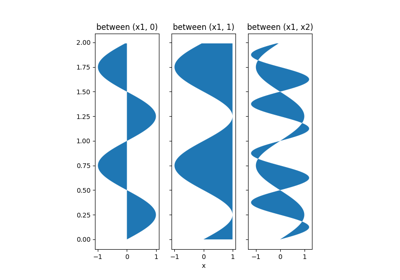
Fill Betweenx Demo
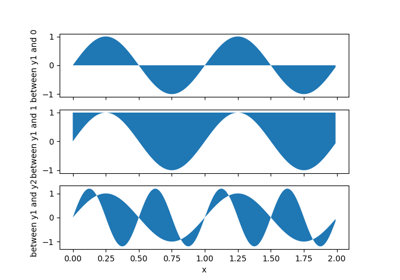
Filling the area between lines
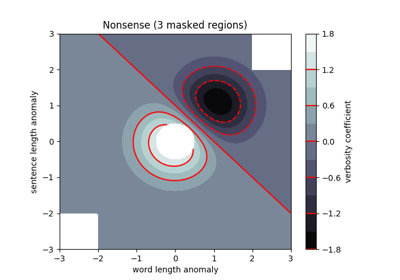
Contourf Demo
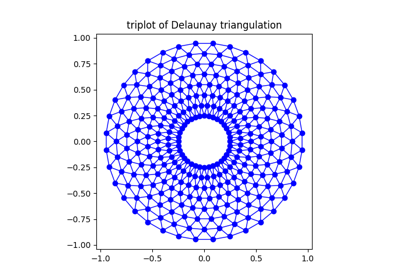
Triplot Demo
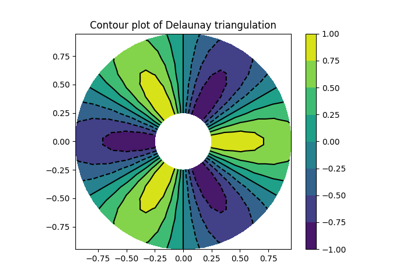
Tricontour Demo
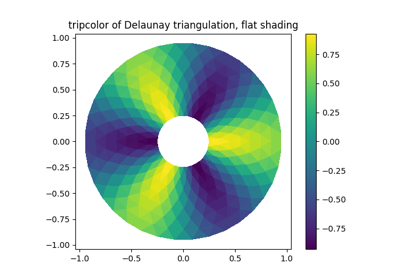
Tripcolor Demo
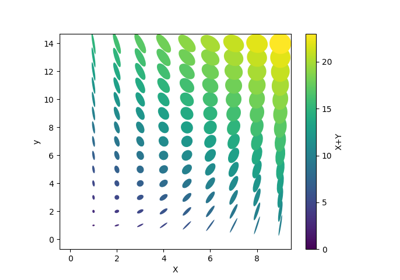
Ellipse Collection
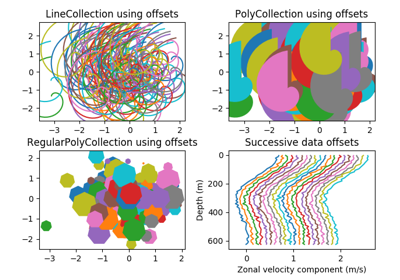
Line, Poly and RegularPoly Collection with autoscaling
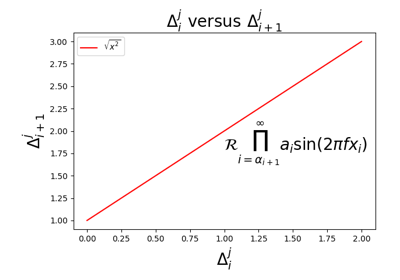
Mathtext Demo
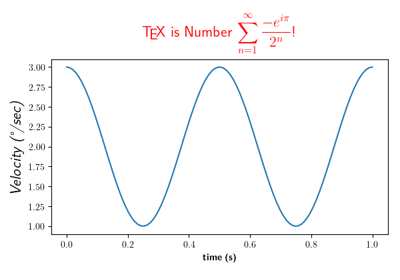
Rendering math equation using TeX
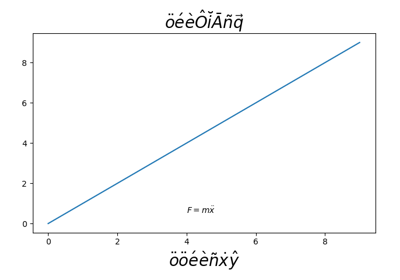
Using accented text in matplotlib
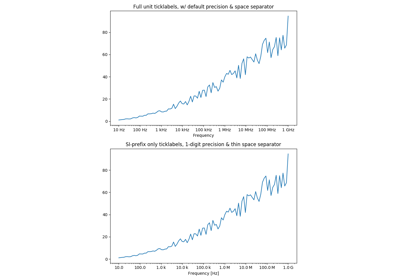
Labeling ticks using engineering notation
Legend Demo
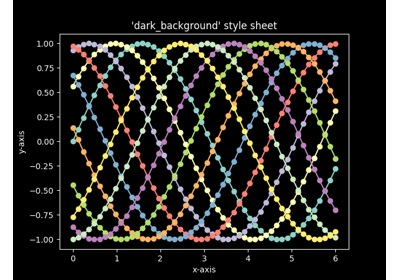
Dark background style sheet
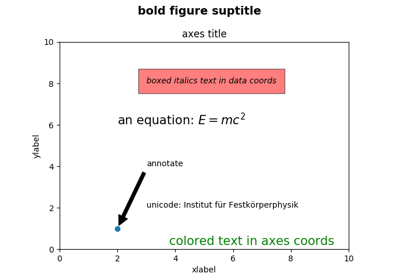
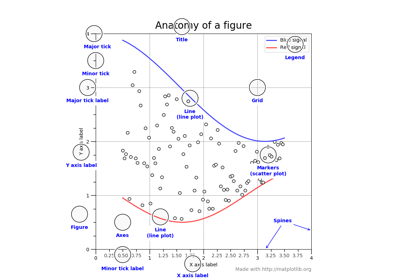
Anatomy of a figure
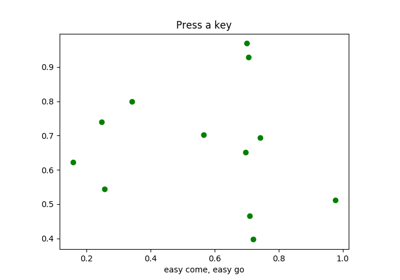
Keypress Demo
Pythonic Matplotlib
Fill Between and Alpha
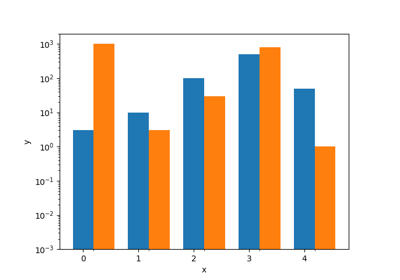
Log Bar
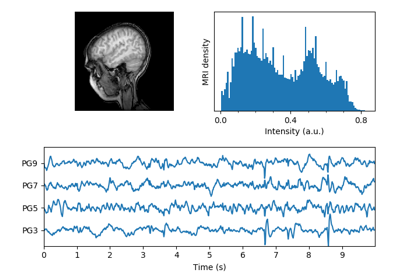
MRI With EEG
Centered Ticklabels
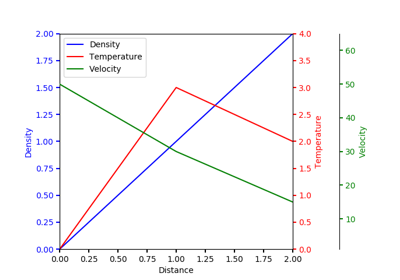
Multiple Yaxis With Spines
Artist tutorial
Constrained Layout Guide
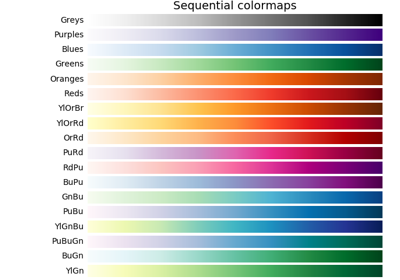
Colormaps in Matplotlib
Text in Matplotlib Plots