You are reading an old version of the documentation (v2.2.4). For the latest version see https://matplotlib.org/stable/api/_as_gen/matplotlib.pyplot.axhspan.html
Version 2.2.4
matplotlib
Fork me on GitHub

Table of Contents

matplotlib.pyplot.axhspan

matplotlib.pyplot.axhspan(ymin, ymax, xmin=0, xmax=1, hold=None, **kwargs)[source]

Add a horizontal span (rectangle) across the axis.

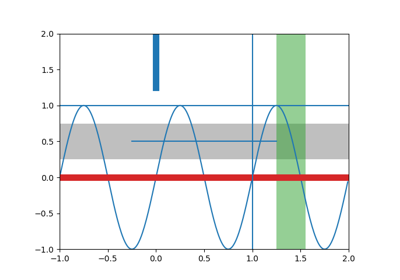
Draw a horizontal span (rectangle) from ymin to ymax. With the default values of xmin = 0 and xmax = 1, this always spans the xrange, regardless of the xlim settings, even if you change them, e.g., with the set_xlim() command. That is, the horizontal extent is in axes coords: 0=left, 0.5=middle, 1.0=right but the y location is in data coordinates.

Parameters:
ymin : float

Lower limit of the horizontal span in data units.

ymax : float

Upper limit of the horizontal span in data units.

xmin : float, optional, default: 0

Lower limit of the vertical span in axes (relative 0-1) units.

xmax : float, optional, default: 1

Upper limit of the vertical span in axes (relative 0-1) units.

Returns:
Polygon : Polygon
Other Parameters:
**kwargs : Polygon properties.
Property Description
agg_filter a filter function, which takes a (m, n, 3) float array and a dpi value, and returns a (m, n, 3) array
alpha float or None
animated bool
antialiased or aa bool or None
capstyle ['butt' | 'round' | 'projecting']
clip_box a Bbox instance
clip_on bool
clip_path [(Path, Transform) | Patch | None]
color matplotlib color spec
contains a callable function
edgecolor or ec mpl color spec, None, 'none', or 'auto'
facecolor or fc mpl color spec, or None for default, or 'none' for no color
figure a Figure instance
fill bool
gid an id string
hatch ['/' | '\' | '|' | '-' | '+' | 'x' | 'o' | 'O' | '.' | '*']
joinstyle ['miter' | 'round' | 'bevel']
label object
linestyle or ls ['solid' | 'dashed', 'dashdot', 'dotted' | (offset, on-off-dash-seq) | '-' | '--' | '-.' | ':' | 'None' | ' ' | '']
linewidth or lw float or None for default
path_effects AbstractPathEffect
picker [None | bool | float | callable]
rasterized bool or None
sketch_params (scale: float, length: float, randomness: float)
snap bool or None
transform Transform
url a url string
visible bool
zorder float

See also

axvspan
Add a vertical span across the axes.

Examples using matplotlib.pyplot.axhspan