Version 2.2.3
Note
Click here to download the full example code
import matplotlib.pyplot as plt
import matplotlib.gridspec as gridspec
import numpy as np
from itertools import product
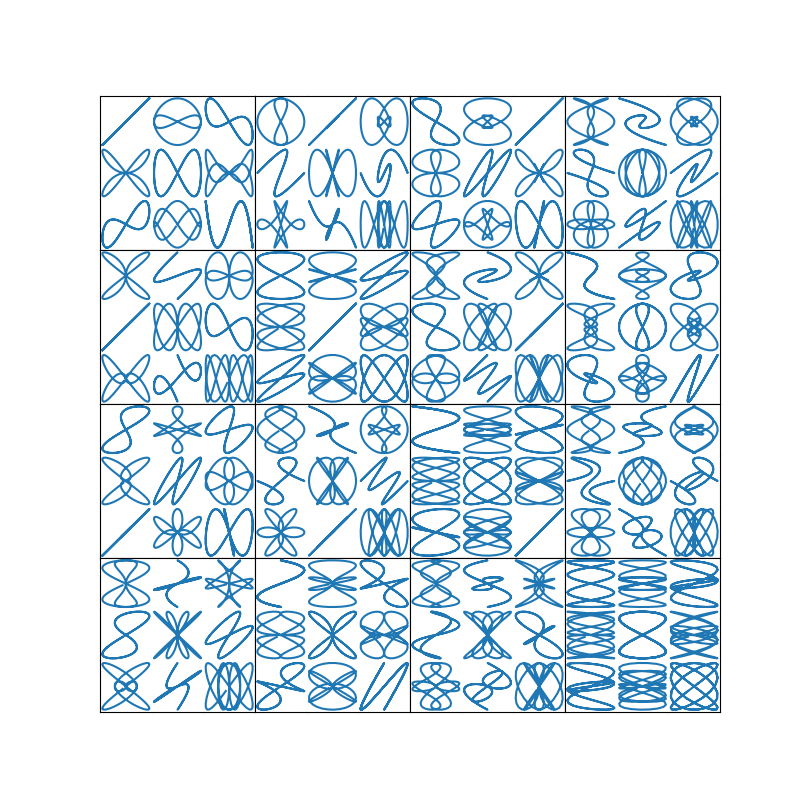
def squiggle_xy(a, b, c, d):
i = np.arange(0.0, 2*np.pi, 0.05)
return np.sin(i*a)*np.cos(i*b), np.sin(i*c)*np.cos(i*d)
fig = plt.figure(figsize=(8, 8))
# gridspec inside gridspec
outer_grid = gridspec.GridSpec(4, 4, wspace=0.0, hspace=0.0)
for i in range(16):
inner_grid = gridspec.GridSpecFromSubplotSpec(3, 3,
subplot_spec=outer_grid[i], wspace=0.0, hspace=0.0)
a = i // 4 + 1
b = i % 4 + 1
for j, (c, d) in enumerate(product(range(1, 4), repeat=2)):
ax = plt.Subplot(fig, inner_grid[j])
ax.plot(*squiggle_xy(a, b, c, d))
ax.set_xticks([])
ax.set_yticks([])
fig.add_subplot(ax)
all_axes = fig.get_axes()
#show only the outside spines
for ax in all_axes:
for sp in ax.spines.values():
sp.set_visible(False)
if ax.is_first_row():
ax.spines['top'].set_visible(True)
if ax.is_last_row():
ax.spines['bottom'].set_visible(True)
if ax.is_first_col():
ax.spines['left'].set_visible(True)
if ax.is_last_col():
ax.spines['right'].set_visible(True)
plt.show()
Total running time of the script: ( 0 minutes 1.171 seconds)
Keywords: matplotlib code example, codex, python plot, pyplot Gallery generated by Sphinx-Gallery