Version 2.2.3
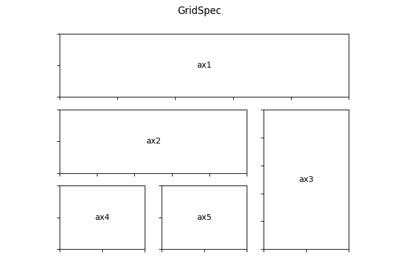
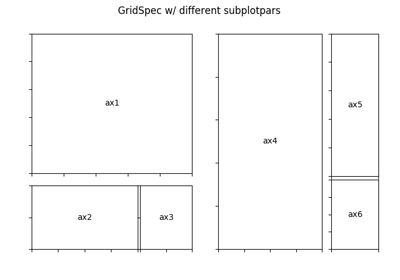
matplotlib.gridspec.GridSpec(nrows, ncols, figure=None, left=None, bottom=None, right=None, top=None, wspace=None, hspace=None, width_ratios=None, height_ratios=None)[source]¶A class that specifies the geometry of the grid that a subplot will be placed. The location of grid is determined by similar way as the SubplotParams.
The number of rows and number of columns of the grid need to be set. Optionally, the subplot layout parameters (e.g., left, right, etc.) can be tuned.
| Parameters: |
|
|---|
Notes
See SubplotParams for descriptions of the layout parameters.
get_subplot_params(figure=None, fig=None)[source]¶Return a dictionary of subplot layout parameters. The default parameters are from rcParams unless a figure attribute is set.
tight_layout(figure, renderer=None, pad=1.08, h_pad=None, w_pad=None, rect=None)[source]¶Adjust subplot parameters to give specified padding.
| Parameters: |
|
|---|
matplotlib.gridspec.GridSpec