Version 2.2.3
matplotlib.dates¶Matplotlib provides sophisticated date plotting capabilities, standing on the
shoulders of python datetime, the add-on modules pytz and
dateutil.
Matplotlib represents dates using floating point numbers specifying the number of days since 0001-01-01 UTC, plus 1. For example, 0001-01-01, 06:00 is 1.25, not 0.25. Values < 1, i.e. dates before 0001-01-01 UTC are not supported.
There are a number of helper functions to convert between datetime
objects and Matplotlib dates:
date2num |
Convert datetime objects to Matplotlib dates. |
num2date |
Convert Matplotlib dates to datetime objects. |
num2timedelta |
Convert number of days to a timedelta object. |
epoch2num |
Convert an epoch or sequence of epochs to the new date format, that is days since 0001. |
num2epoch |
Convert days since 0001 to epoch. |
mx2num |
Convert mx datetime instance (or sequence of mx instances) to the new date format. |
drange |
Return a sequence of equally spaced Matplotlib dates. |
Note
Like Python's datetime, mpl uses the Gregorian calendar for all conversions between dates and floating point numbers. This practice is not universal, and calendar differences can cause confusing differences between what Python and mpl give as the number of days since 0001-01-01 and what other software and databases yield. For example, the US Naval Observatory uses a calendar that switches from Julian to Gregorian in October, 1582. Hence, using their calculator, the number of days between 0001-01-01 and 2006-04-01 is 732403, whereas using the Gregorian calendar via the datetime module we find:
In [1]: date(2006, 4, 1).toordinal() - date(1, 1, 1).toordinal()
Out[1]: 732401
All the Matplotlib date converters, tickers and formatters are timezone aware.
If no explicit timezone is provided, the rcParam timezone is assumend. If
you want to use a custom time zone, pass a pytz.timezone instance
with the tz keyword argument to num2date(), plot_date(), and any
custom date tickers or locators you create.
See pytz for information on pytz and
timezone handling.
A wide range of specific and general purpose date tick locators and
formatters are provided in this module. See
matplotlib.ticker for general information on tick locators
and formatters. These are described below.
The dateutil module provides additional code to handle date ticking, making it easy to place ticks on any kinds of dates. See examples below.
Most of the date tickers can locate single or multiple values. For example:
# import constants for the days of the week
from matplotlib.dates import MO, TU, WE, TH, FR, SA, SU

# tick on mondays every week
loc = WeekdayLocator(byweekday=MO, tz=tz)

# tick on mondays and saturdays
loc = WeekdayLocator(byweekday=(MO, SA))
In addition, most of the constructors take an interval argument:
# tick on mondays every second week
loc = WeekdayLocator(byweekday=MO, interval=2)
The rrule locator allows completely general date ticking:
# tick every 5th easter
rule = rrulewrapper(YEARLY, byeaster=1, interval=5)
loc = RRuleLocator(rule)
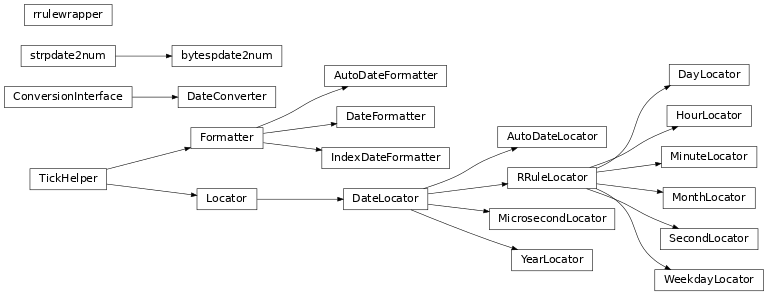
Here are all the date tickers:
MicrosecondLocator: locate microsecondsSecondLocator: locate secondsMinuteLocator: locate minutesHourLocator: locate hoursDayLocator: locate specified days of the monthWeekdayLocator: Locate days of the week, e.g., MO, TUMonthLocator: locate months, e.g., 7 for julyYearLocator: locate years that are multiples of baseRRuleLocator: locate using amatplotlib.dates.rrulewrapper. Therrulewrapperis a simple wrapper around adateutil.rrule(dateutil) which allow almost arbitrary date tick specifications. See rrule example.AutoDateLocator: On autoscale, this class picks the bestDateLocator(e.g.,RRuleLocator) to set the view limits and the tick locations. If called withinterval_multiples=Trueit will make ticks line up with sensible multiples of the tick intervals. E.g. if the interval is 4 hours, it will pick hours 0, 4, 8, etc as ticks. This behaviour is not guaranteed by default.
Here all all the date formatters:
AutoDateFormatter: attempts to figure out the best format to use. This is most useful when used with theAutoDateLocator.DateFormatter: usestrftime()format stringsIndexDateFormatter: date plots with implicit x indexing.
matplotlib.dates.date2num(d)[source]¶Convert datetime objects to Matplotlib dates.
| Parameters: |
|
|---|---|
| Returns: |
|
Notes
The addition of one here is a historical artifact. Also, note that the Gregorian calendar is assumed; this is not universal practice. For details see the module docstring.
matplotlib.dates.num2date(x, tz=None)[source]¶Convert Matplotlib dates to datetime objects.
| Parameters: |
|
|---|---|
| Returns: |
|
Notes
The addition of one here is a historical artifact. Also, note that the Gregorian calendar is assumed; this is not universal practice. For details, see the module docstring.
matplotlib.dates.num2timedelta(x)[source]¶Convert number of days to a timedelta object.
If x is a sequence, a sequence of timedelta objects will
be returned.
| Parameters: |
|
|---|---|
| Returns: |
|
matplotlib.dates.drange(dstart, dend, delta)[source]¶Return a sequence of equally spaced Matplotlib dates.
The dates start at dstart and reach up to, but not including dend. They are spaced by delta.
| Parameters: |
|
|---|---|
| Returns: |
|
matplotlib.dates.epoch2num(e)[source]¶Convert an epoch or sequence of epochs to the new date format, that is days since 0001.
matplotlib.dates.num2epoch(d)[source]¶Convert days since 0001 to epoch. d can be a number or sequence.
matplotlib.dates.mx2num(mxdates)[source]¶Convert mx datetime instance (or sequence of mx
instances) to the new date format.
matplotlib.dates.DateFormatter(fmt, tz=None)[source]¶Bases: matplotlib.ticker.Formatter
Tick location is seconds since the epoch. Use a strftime()
format string.
Python only supports datetime strftime() formatting
for years greater than 1900. Thanks to Andrew Dalke, Dalke
Scientific Software who contributed the strftime() code
below to include dates earlier than this year.
strftime() format string; tz is thetzinfo instance.illegal_s = re.compile('((^|[^%])(%%)*%s)')¶strftime(dt, fmt=None)[source]¶Refer to documentation for datetime.datetime.strftime()
fmt is a datetime.datetime.strftime() format string.
Warning: For years before 1900, depending upon the current locale it is possible that the year displayed with %x might be incorrect. For years before 100, %y and %Y will yield zero-padded strings.
strftime_pre_1900(dt, fmt=None)[source]¶Call time.strftime for years before 1900 by rolling forward a multiple of 28 years.
fmt is a strftime() format string.
Dalke: I hope I did this math right. Every 28 years the calendar repeats, except through century leap years excepting the 400 year leap years. But only if you're using the Gregorian calendar.
matplotlib.dates.IndexDateFormatter(t, fmt, tz=None)[source]¶Bases: matplotlib.ticker.Formatter
Use with IndexLocator to cycle format
strings by index.
t is a sequence of dates (floating point days). fmt is a
strftime() format string.
matplotlib.dates.AutoDateFormatter(locator, tz=None, defaultfmt='%Y-%m-%d')[source]¶Bases: matplotlib.ticker.Formatter
This class attempts to figure out the best format to use. This is
most useful when used with the AutoDateLocator.
The AutoDateFormatter has a scale dictionary that maps the scale of the tick (the distance in days between one major tick) and a format string. The default looks like this:
self.scaled = {
    DAYS_PER_YEAR: rcParams['date.autoformat.year'],
    DAYS_PER_MONTH: rcParams['date.autoformat.month'],
    1.0: rcParams['date.autoformat.day'],
    1. / HOURS_PER_DAY: rcParams['date.autoformat.hour'],
    1. / (MINUTES_PER_DAY): rcParams['date.autoformat.minute'],
    1. / (SEC_PER_DAY): rcParams['date.autoformat.second'],
    1. / (MUSECONDS_PER_DAY): rcParams['date.autoformat.microsecond'],
    }
The algorithm picks the key in the dictionary that is >= the current scale and uses that format string. You can customize this dictionary by doing:
>>> locator = AutoDateLocator()
>>> formatter = AutoDateFormatter(locator)
>>> formatter.scaled[1/(24.*60.)] = '%M:%S' # only show min and sec
A custom FuncFormatter can also be used.
The following example shows how to use a custom format function to strip
trailing zeros from decimal seconds and adds the date to the first
ticklabel:
>>> def my_format_function(x, pos=None):
...     x = matplotlib.dates.num2date(x)
...     if pos == 0:
...         fmt = '%D %H:%M:%S.%f'
...     else:
...         fmt = '%H:%M:%S.%f'
...     label = x.strftime(fmt)
...     label = label.rstrip("0")
...     label = label.rstrip(".")
...     return label
>>> from matplotlib.ticker import FuncFormatter
>>> formatter.scaled[1/(24.*60.)] = FuncFormatter(my_format_function)
Autoformat the date labels. The default format is the one to use
if none of the values in self.scaled are greater than the unit
returned by locator._get_unit().
matplotlib.dates.DateLocator(tz=None)[source]¶Bases: matplotlib.ticker.Locator
Determines the tick locations when plotting dates.
This class is subclassed by other Locators and is not meant to be used on its own.
tz is a tzinfo instance.
hms0d = {'byhour': 0, 'byminute': 0, 'bysecond': 0}¶matplotlib.dates.RRuleLocator(o, tz=None)[source]¶Bases: matplotlib.dates.DateLocator
tick_values(vmin, vmax)[source]¶Return the values of the located ticks given vmin and vmax.
Note
To get tick locations with the vmin and vmax values defined
automatically for the associated axis simply call
the Locator instance:
>>> print((type(loc)))
<type 'Locator'>
>>> print((loc()))
[1, 2, 3, 4]
matplotlib.dates.AutoDateLocator(tz=None, minticks=5, maxticks=None, interval_multiples=False)[source]¶Bases: matplotlib.dates.DateLocator
On autoscale, this class picks the best
DateLocator to set the view limits and the tick
locations.
minticks is the minimum number of ticks desired, which is used to select the type of ticking (yearly, monthly, etc.).
maxticks is the maximum number of ticks desired, which controls
any interval between ticks (ticking every other, every 3, etc.).
For really fine-grained control, this can be a dictionary mapping
individual rrule frequency constants (YEARLY, MONTHLY, etc.)
to their own maximum number of ticks. This can be used to keep
the number of ticks appropriate to the format chosen in
AutoDateFormatter. Any frequency not specified in this
dictionary is given a default value.
tz is a tzinfo instance.
interval_multiples is a boolean that indicates whether ticks should be chosen to be multiple of the interval. This will lock ticks to 'nicer' locations. For example, this will force the ticks to be at hours 0,6,12,18 when hourly ticking is done at 6 hour intervals.
The AutoDateLocator has an interval dictionary that maps the frequency of the tick (a constant from dateutil.rrule) and a multiple allowed for that ticking. The default looks like this:
self.intervald = {
  YEARLY  : [1, 2, 4, 5, 10, 20, 40, 50, 100, 200, 400, 500,
            1000, 2000, 4000, 5000, 10000],
  MONTHLY : [1, 2, 3, 4, 6],
  DAILY   : [1, 2, 3, 7, 14],
  HOURLY  : [1, 2, 3, 4, 6, 12],
  MINUTELY: [1, 5, 10, 15, 30],
  SECONDLY: [1, 5, 10, 15, 30],
  MICROSECONDLY: [1, 2, 5, 10, 20, 50, 100, 200, 500, 1000, 2000,
                 5000, 10000, 20000, 50000, 100000, 200000, 500000,
                 1000000],
  }
The interval is used to specify multiples that are appropriate for the frequency of ticking. For instance, every 7 days is sensible for daily ticks, but for minutes/seconds, 15 or 30 make sense. You can customize this dictionary by doing:
locator = AutoDateLocator()
locator.intervald[HOURLY] = [3] # only show every 3 hours
nonsingular(vmin, vmax)[source]¶Given the proposed upper and lower extent, adjust the range if it is too close to being singular (i.e. a range of ~0).
tick_values(vmin, vmax)[source]¶Return the values of the located ticks given vmin and vmax.
Note
To get tick locations with the vmin and vmax values defined
automatically for the associated axis simply call
the Locator instance:
>>> print((type(loc)))
<type 'Locator'>
>>> print((loc()))
[1, 2, 3, 4]
matplotlib.dates.YearLocator(base=1, month=1, day=1, tz=None)[source]¶Bases: matplotlib.dates.DateLocator
Make ticks on a given day of each year that is a multiple of base.
Examples:
# Tick every year on Jan 1st
locator = YearLocator()

# Tick every 5 years on July 4th
locator = YearLocator(5, month=7, day=4)
Mark years that are multiple of base on a given month and day (default jan 1).
tick_values(vmin, vmax)[source]¶Return the values of the located ticks given vmin and vmax.
Note
To get tick locations with the vmin and vmax values defined
automatically for the associated axis simply call
the Locator instance:
>>> print((type(loc)))
<type 'Locator'>
>>> print((loc()))
[1, 2, 3, 4]
matplotlib.dates.MonthLocator(bymonth=None, bymonthday=1, interval=1, tz=None)[source]¶Bases: matplotlib.dates.RRuleLocator
Make ticks on occurrences of each month, e.g., 1, 3, 12.
Mark every month in bymonth; bymonth can be an int or
sequence. Default is range(1,13), i.e. every month.
interval is the interval between each iteration. For
example, if interval=2, mark every second occurrence.
matplotlib.dates.WeekdayLocator(byweekday=1, interval=1, tz=None)[source]¶Bases: matplotlib.dates.RRuleLocator
Make ticks on occurrences of each weekday.
Mark every weekday in byweekday; byweekday can be a number or sequence.
Elements of byweekday must be one of MO, TU, WE, TH, FR, SA,
SU, the constants from dateutil.rrule, which have been
imported into the matplotlib.dates namespace.
interval specifies the number of weeks to skip. For example,
interval=2 plots every second week.
matplotlib.dates.DayLocator(bymonthday=None, interval=1, tz=None)[source]¶Bases: matplotlib.dates.RRuleLocator
Make ticks on occurrences of each day of the month. For example, 1, 15, 30.
Mark every day in bymonthday; bymonthday can be an int or sequence.
Default is to tick every day of the month: bymonthday=range(1,32)
matplotlib.dates.HourLocator(byhour=None, interval=1, tz=None)[source]¶Bases: matplotlib.dates.RRuleLocator
Make ticks on occurrences of each hour.
Mark every hour in byhour; byhour can be an int or sequence.
Default is to tick every hour: byhour=range(24)
interval is the interval between each iteration. For
example, if interval=2, mark every second occurrence.
matplotlib.dates.MinuteLocator(byminute=None, interval=1, tz=None)[source]¶Bases: matplotlib.dates.RRuleLocator
Make ticks on occurrences of each minute.
Mark every minute in byminute; byminute can be an int or
sequence. Default is to tick every minute: byminute=range(60)
interval is the interval between each iteration. For
example, if interval=2, mark every second occurrence.
matplotlib.dates.SecondLocator(bysecond=None, interval=1, tz=None)[source]¶Bases: matplotlib.dates.RRuleLocator
Make ticks on occurrences of each second.
Mark every second in bysecond; bysecond can be an int or
sequence. Default is to tick every second: bysecond = range(60)
interval is the interval between each iteration. For
example, if interval=2, mark every second occurrence.
matplotlib.dates.MicrosecondLocator(interval=1, tz=None)[source]¶Bases: matplotlib.dates.DateLocator
Make ticks on regular intervals of one or more microsecond(s).
Note
Due to the floating point representation of time in days since 0001-01-01 UTC (plus 1), plotting data with microsecond time resolution does not work well with current dates.
If you want microsecond resolution time plots, it is strongly recommended to use floating point seconds, not datetime-like time representation.
If you really must use datetime.datetime() or similar and still need microsecond precision, your only chance is to use very early years; using year 0001 is recommended.
interval is the interval between each iteration. For
example, if interval=2, mark every second microsecond.
tick_values(vmin, vmax)[source]¶Return the values of the located ticks given vmin and vmax.
Note
To get tick locations with the vmin and vmax values defined
automatically for the associated axis simply call
the Locator instance:
>>> print((type(loc)))
<type 'Locator'>
>>> print((loc()))
[1, 2, 3, 4]
matplotlib.dates.rrule(freq, dtstart=None, interval=1, wkst=None, count=None, until=None, bysetpos=None, bymonth=None, bymonthday=None, byyearday=None, byeaster=None, byweekno=None, byweekday=None, byhour=None, byminute=None, bysecond=None, cache=False)[source]¶Bases: dateutil.rrule.rrulebase
That's the base of the rrule operation. It accepts all the keywords defined in the RFC as its constructor parameters (except byday, which was renamed to byweekday) and more. The constructor prototype is:
rrule(freq)
Where freq must be one of YEARLY, MONTHLY, WEEKLY, DAILY, HOURLY, MINUTELY, or SECONDLY.
Note
Per RFC section 3.3.10, recurrence instances falling on invalid dates and times are ignored rather than coerced:
Recurrence rules may generate recurrence instances with an invalid date (e.g., February 30) or nonexistent local time (e.g., 1:30 AM on a day where the local time is moved forward by an hour at 1:00 AM). Such recurrence instances MUST be ignored and MUST NOT be counted as part of the recurrence set.
This can lead to possibly surprising behavior when, for example, the start date occurs at the end of the month:
>>> from dateutil.rrule import rrule, MONTHLY
>>> from datetime import datetime
>>> start_date = datetime(2014, 12, 31)
>>> list(rrule(freq=MONTHLY, count=4, dtstart=start_date))
...
[datetime.datetime(2014, 12, 31, 0, 0),
 datetime.datetime(2015, 1, 31, 0, 0),
 datetime.datetime(2015, 3, 31, 0, 0),
 datetime.datetime(2015, 5, 31, 0, 0)]
Additionally, it supports the following keyword arguments:
| Parameters: |
|
|---|
matplotlib.dates.relativedelta(dt1=None, dt2=None, years=0, months=0, days=0, leapdays=0, weeks=0, hours=0, minutes=0, seconds=0, microseconds=0, year=None, month=None, day=None, weekday=None, yearday=None, nlyearday=None, hour=None, minute=None, second=None, microsecond=None)[source]¶Bases: object
The relativedelta type is based on the specification of the excellent work done by M.-A. Lemburg in his mx.DateTime extension. However, notice that this type does NOT implement the same algorithm as his work. Do NOT expect it to behave like mx.DateTime's counterpart.
There are two different ways to build a relativedelta instance. The first one is passing it two date/datetime classes:
relativedelta(datetime1, datetime2)
The second one is passing it any number of the following keyword arguments:
relativedelta(arg1=x,arg2=y,arg3=z...)

year, month, day, hour, minute, second, microsecond:
    Absolute information (argument is singular); adding or subtracting a
    relativedelta with absolute information does not perform an arithmetic
    operation, but rather REPLACES the corresponding value in the
    original datetime with the value(s) in relativedelta.

years, months, weeks, days, hours, minutes, seconds, microseconds:
    Relative information, may be negative (argument is plural); adding
    or subtracting a relativedelta with relative information performs
    the corresponding aritmetic operation on the original datetime value
    with the information in the relativedelta.

weekday:
    One of the weekday instances (MO, TU, etc). These
    instances may receive a parameter N, specifying the Nth
    weekday, which could be positive or negative (like MO(+1)
    or MO(-2). Not specifying it is the same as specifying
    +1. You can also use an integer, where 0=MO. Notice that
    if the calculated date is already Monday, for example,
    using MO(1) or MO(-1) won't change the day.

leapdays:
    Will add given days to the date found, if year is a leap
    year, and the date found is post 28 of february.

yearday, nlyearday:
    Set the yearday or the non-leap year day (jump leap days).
    These are converted to day/month/leapdays information.
There are relative and absolute forms of the keyword arguments. The plural is relative, and the singular is absolute. For each argument in the order below, the absolute form is applied first (by setting each attribute to that value) and then the relative form (by adding the value to the attribute).
The order of attributes considered when this relativedelta is added to a datetime is:
Finally, weekday is applied, using the rule described above.
For example
>>> dt = datetime(2018, 4, 9, 13, 37, 0)
>>> delta = relativedelta(hours=25, day=1, weekday=MO(1))
datetime(2018, 4, 2, 14, 37, 0)
First, the day is set to 1 (the first of the month), then 25 hours are added, to get to the 2nd day and 14th hour, finally the weekday is applied, but since the 2nd is already a Monday there is no effect.
normalized()[source]¶Return a version of this object represented entirely using integer values for the relative attributes.
>>> relativedelta(days=1.5, hours=2).normalized()
relativedelta(days=1, hours=14)
| Returns: | Returns a dateutil.relativedelta.relativedelta object. |
|---|
weeks