Version 2.2.2
Note
Click here to download the full example code
Examples illustrating the use of plt.subplots().
This function creates a figure and a grid of subplots with a single call, while providing reasonable control over how the individual plots are created. For very refined tuning of subplot creation, you can still use add_subplot() directly on a new figure.
import matplotlib.pyplot as plt
import numpy as np

# Simple data to display in various forms
x = np.linspace(0, 2 * np.pi, 400)
y = np.sin(x ** 2)

plt.close('all')
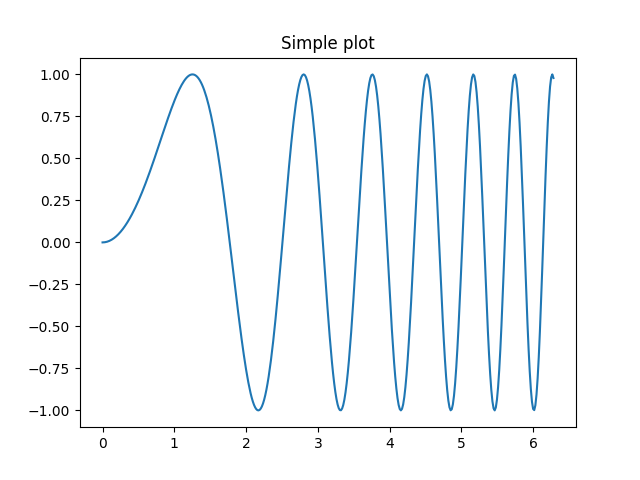
Just a figure and one subplot
f, ax = plt.subplots()
ax.plot(x, y)
ax.set_title('Simple plot')
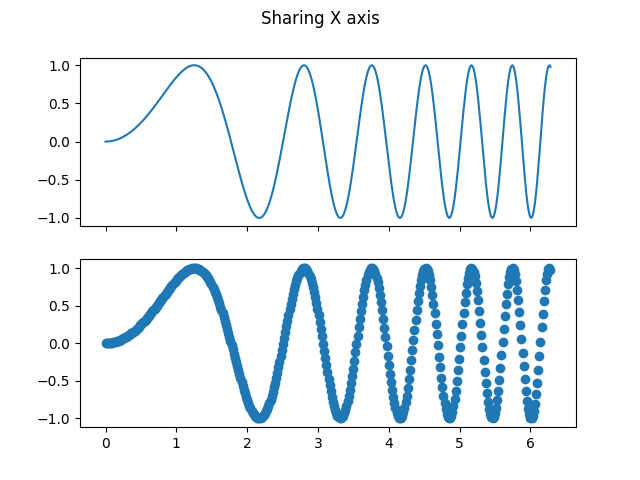
Two subplots, the axes array is 1-d
f, axarr = plt.subplots(2, sharex=True)
f.suptitle('Sharing X axis')
axarr[0].plot(x, y)
axarr[1].scatter(x, y)
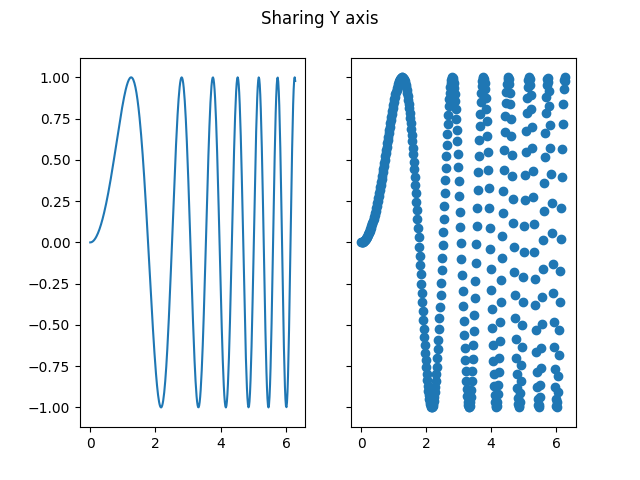
Two subplots, unpack the axes array immediately
f, (ax1, ax2) = plt.subplots(1, 2, sharey=True)
f.suptitle('Sharing Y axis')
ax1.plot(x, y)
ax2.scatter(x, y)
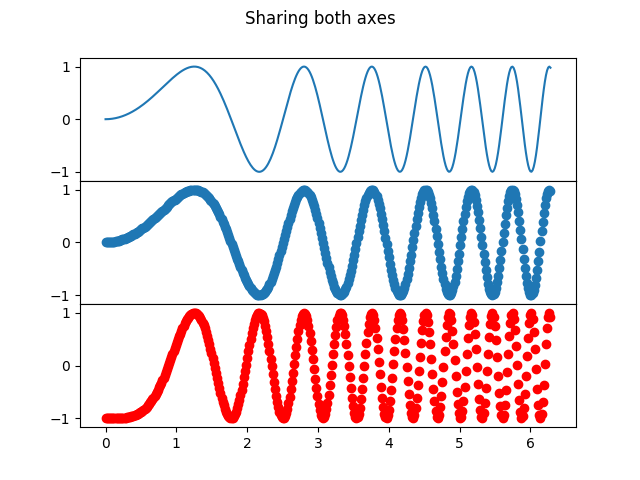
Three subplots sharing both x/y axes
f, axarr = plt.subplots(3, sharex=True, sharey=True)
f.suptitle('Sharing both axes')
axarr[0].plot(x, y)
axarr[1].scatter(x, y)
axarr[2].scatter(x, 2 * y ** 2 - 1, color='r')
# Bring subplots close to each other.
f.subplots_adjust(hspace=0)
# Hide x labels and tick labels for all but bottom plot.
for ax in axarr:
    ax.label_outer()
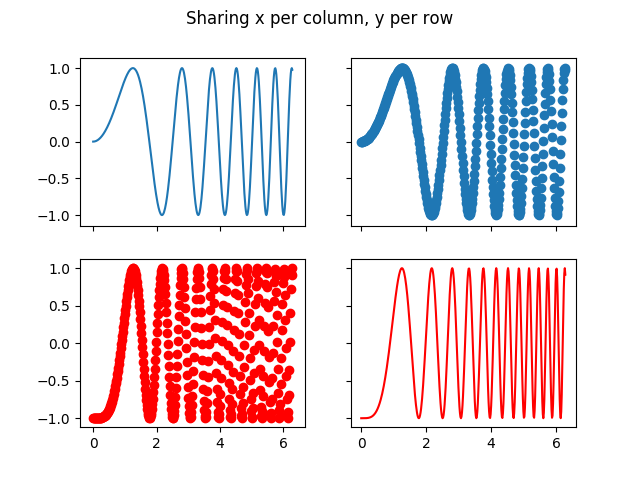
Row and column sharing
f, ((ax1, ax2), (ax3, ax4)) = plt.subplots(2, 2, sharex='col', sharey='row')
f.suptitle('Sharing x per column, y per row')
ax1.plot(x, y)
ax2.scatter(x, y)
ax3.scatter(x, 2 * y ** 2 - 1, color='r')
ax4.plot(x, 2 * y ** 2 - 1, color='r')
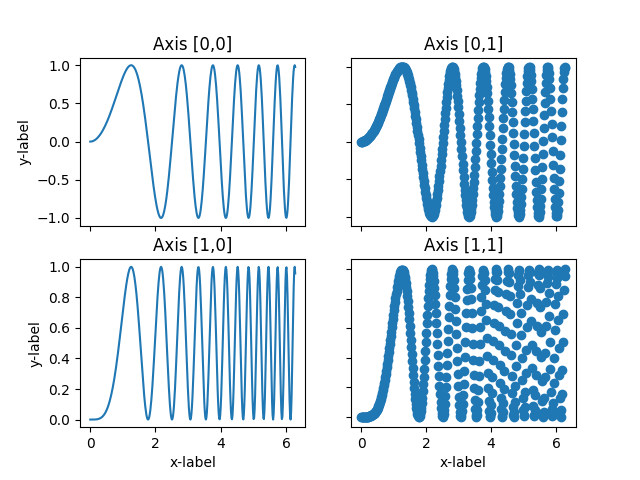
Four axes, returned as a 2-d array
f, axarr = plt.subplots(2, 2)
axarr[0, 0].plot(x, y)
axarr[0, 0].set_title('Axis [0,0]')
axarr[0, 1].scatter(x, y)
axarr[0, 1].set_title('Axis [0,1]')
axarr[1, 0].plot(x, y ** 2)
axarr[1, 0].set_title('Axis [1,0]')
axarr[1, 1].scatter(x, y ** 2)
axarr[1, 1].set_title('Axis [1,1]')
for ax in axarr.flat:
    ax.set(xlabel='x-label', ylabel='y-label')
# Hide x labels and tick labels for top plots and y ticks for right plots.
for ax in axarr.flat:
    ax.label_outer()
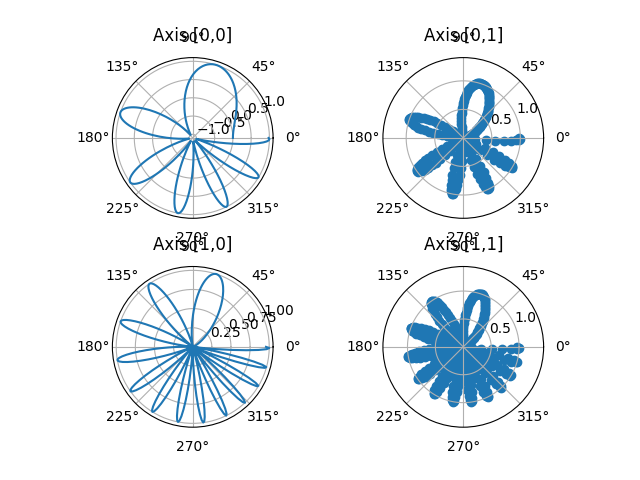
Four polar axes
f, axarr = plt.subplots(2, 2, subplot_kw=dict(projection='polar'))
axarr[0, 0].plot(x, y)
axarr[0, 0].set_title('Axis [0,0]')
axarr[0, 1].scatter(x, y)
axarr[0, 1].set_title('Axis [0,1]')
axarr[1, 0].plot(x, y ** 2)
axarr[1, 0].set_title('Axis [1,0]')
axarr[1, 1].scatter(x, y ** 2)
axarr[1, 1].set_title('Axis [1,1]')
# Fine-tune figure; make subplots farther from each other.
f.subplots_adjust(hspace=0.3)

plt.show()
Keywords: matplotlib code example, codex, python plot, pyplot Gallery generated by Sphinx-Gallery