Version 2.2.2
Note
Click here to download the full example code
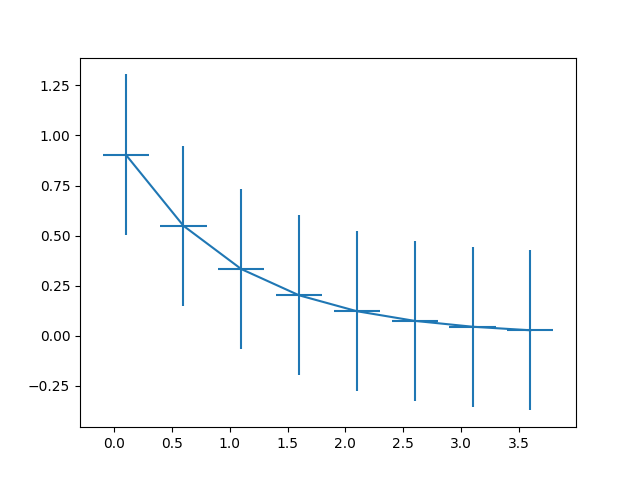
This exhibits the most basic use of the error bar method. In this case, constant values are provided for the error in both the x- and y-directions.
import numpy as np
import matplotlib.pyplot as plt

# example data
x = np.arange(0.1, 4, 0.5)
y = np.exp(-x)

fig, ax = plt.subplots()
ax.errorbar(x, y, xerr=0.2, yerr=0.4)
plt.show()
Keywords: matplotlib code example, codex, python plot, pyplot Gallery generated by Sphinx-Gallery