Version 2.2.2
Note
Click here to download the full example code
There are some instances where you have data in a format that lets you
access particular variables with strings. For example, with
numpy.recarray or pandas.DataFrame.
Matplotlib allows you provide such an object with the data keyword
argument. If provided, then you may generate plots with the strings
corresponding to these variables.
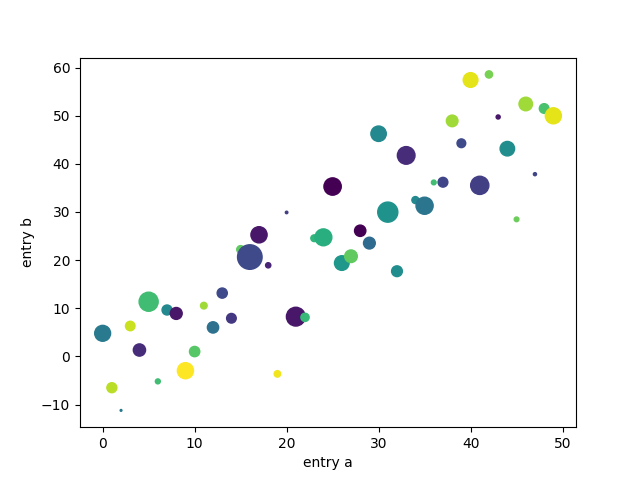
import numpy as np
import matplotlib.pyplot as plt
np.random.seed(19680801)

data = {'a': np.arange(50),
        'c': np.random.randint(0, 50, 50),
        'd': np.random.randn(50)}
data['b'] = data['a'] + 10 * np.random.randn(50)
data['d'] = np.abs(data['d']) * 100

fig, ax = plt.subplots()
ax.scatter('a', 'b', c='c', s='d', data=data)
ax.set(xlabel='entry a', ylabel='entry b')
plt.show()
Keywords: matplotlib code example, codex, python plot, pyplot Gallery generated by Sphinx-Gallery