matplotlib.pyplot.tight_layout
matplotlib.pyplot.
tight_layout
Automatically adjust subplot parameters to give specified padding.
padding between the figure edge and the edges of subplots, as a fraction of the font-size.
padding (height/width) between edges of adjacent subplots. Defaults to pad_inches.
pad_inches
(left, bottom, right, top) in the normalized figure coordinate that the whole subplots area (including labels) will fit into. Default is (0, 0, 1, 1).
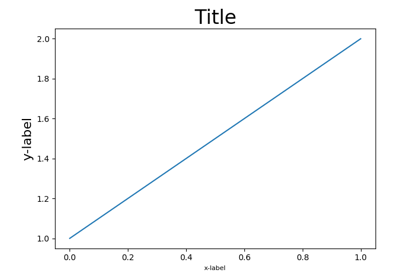
Demo Tight Layout
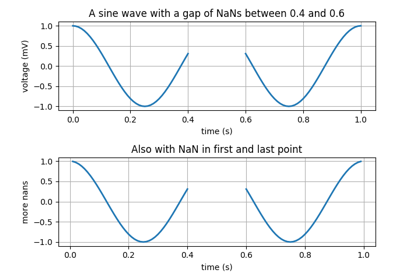
Nan Test
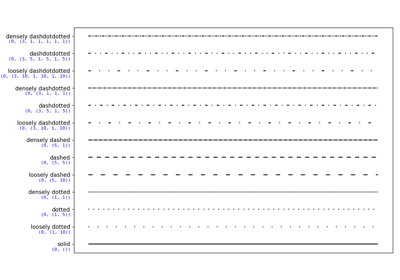
Linestyles
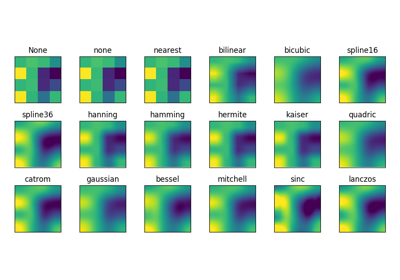
Interpolations for imshow/matshow
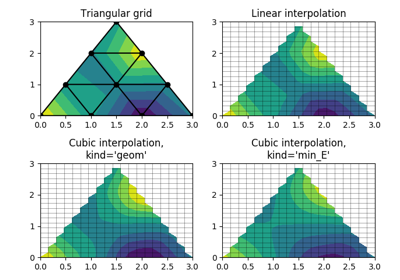
Triinterp Demo
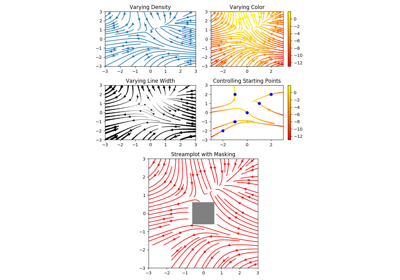
Streamplot
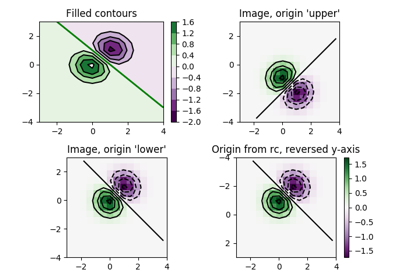
Contour Image
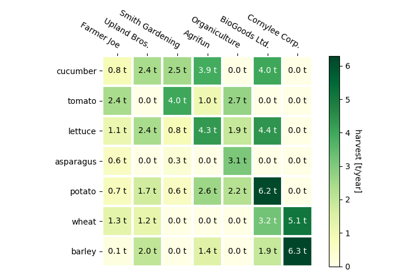
Creating annotated heatmaps
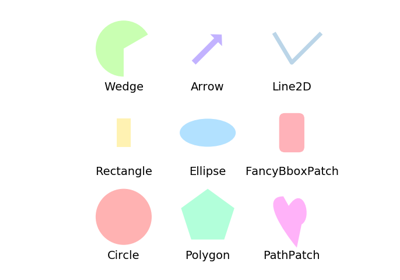
Reference for matplotlib artists
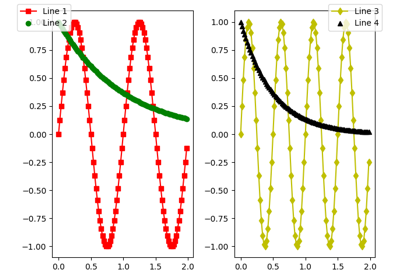
Figure legend demo
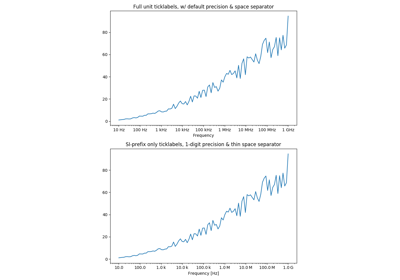
Labeling ticks using engineering notation
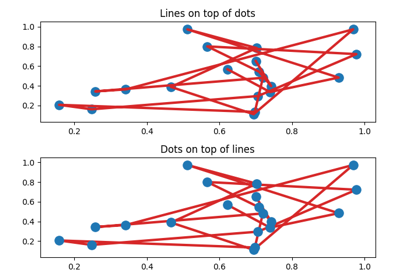
Zorder Demo
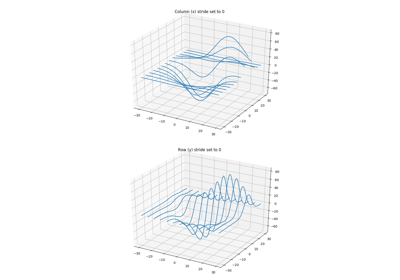
3D wireframe plots in one direction
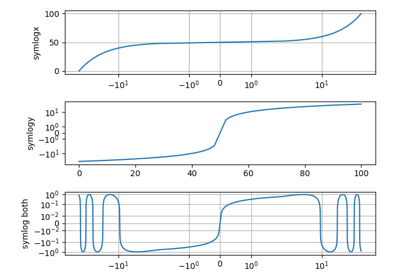
Symlog Demo
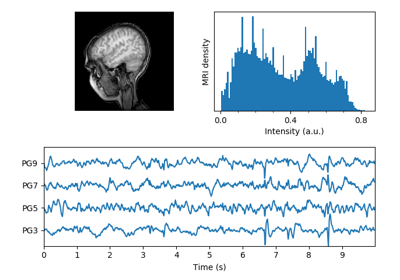
MRI With EEG
Pgf Texsystem
Pgf Fonts
Pgf Preamble
Tight Layout guide