Version 2.2.2
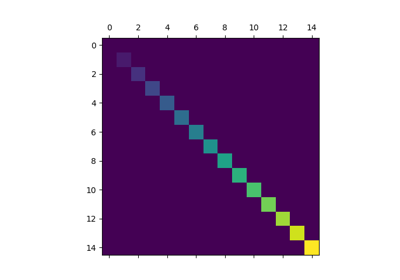
matplotlib.pyplot.matshow(A, fignum=None, **kw)[source]¶Display an array as a matrix in a new figure window.
The origin is set at the upper left hand corner and rows (first dimension of the array) are displayed horizontally. The aspect ratio of the figure window is that of the array, unless this would make an excessively short or narrow figure.
Tick labels for the xaxis are placed on top.
With the exception of fignum, keyword arguments are passed to
imshow(). You may set the origin
kwarg to “lower” if you want the first row in the array to be
at the bottom instead of the top.
By default, matshow() creates a new figure window with
automatic numbering. If fignum is given as an integer, the
created figure will use this figure number. Because of how
matshow() tries to set the figure aspect ratio to be the
one of the array, if you provide the number of an already
existing figure, strange things may happen.
If fignum is False or 0, a new figure window will NOT be created.