Version 2.2.0
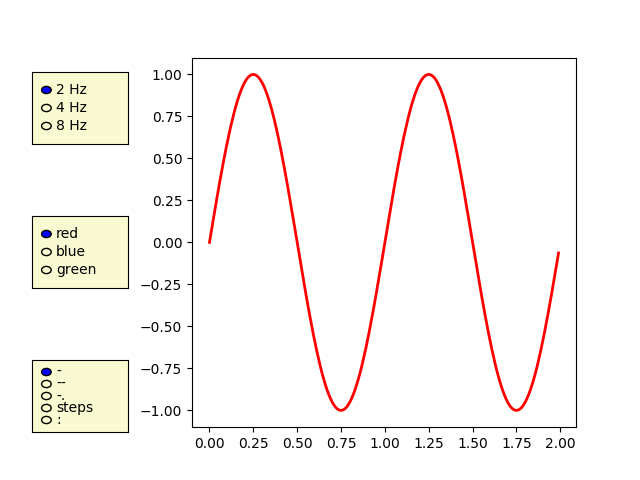
Using radio buttons to choose properties of your plot.
Radio buttons let you choose between multiple options in a visualization. In this case, the buttons let the user choose one of the three different sine waves to be shown in the plot.
import numpy as np
import matplotlib.pyplot as plt
from matplotlib.widgets import RadioButtons

t = np.arange(0.0, 2.0, 0.01)
s0 = np.sin(2*np.pi*t)
s1 = np.sin(4*np.pi*t)
s2 = np.sin(8*np.pi*t)

fig, ax = plt.subplots()
l, = ax.plot(t, s0, lw=2, color='red')
plt.subplots_adjust(left=0.3)

axcolor = 'lightgoldenrodyellow'
rax = plt.axes([0.05, 0.7, 0.15, 0.15], facecolor=axcolor)
radio = RadioButtons(rax, ('2 Hz', '4 Hz', '8 Hz'))


def hzfunc(label):
    hzdict = {'2 Hz': s0, '4 Hz': s1, '8 Hz': s2}
    ydata = hzdict[label]
    l.set_ydata(ydata)
    plt.draw()
radio.on_clicked(hzfunc)

rax = plt.axes([0.05, 0.4, 0.15, 0.15], facecolor=axcolor)
radio2 = RadioButtons(rax, ('red', 'blue', 'green'))


def colorfunc(label):
    l.set_color(label)
    plt.draw()
radio2.on_clicked(colorfunc)

rax = plt.axes([0.05, 0.1, 0.15, 0.15], facecolor=axcolor)
radio3 = RadioButtons(rax, ('-', '--', '-.', 'steps', ':'))


def stylefunc(label):
    l.set_linestyle(label)
    plt.draw()
radio3.on_clicked(stylefunc)

plt.show()