Version 2.2.0
Instead of plotting a legend on each axis, a legend for all the artists on all the sub-axes of a figure can be plotted instead.
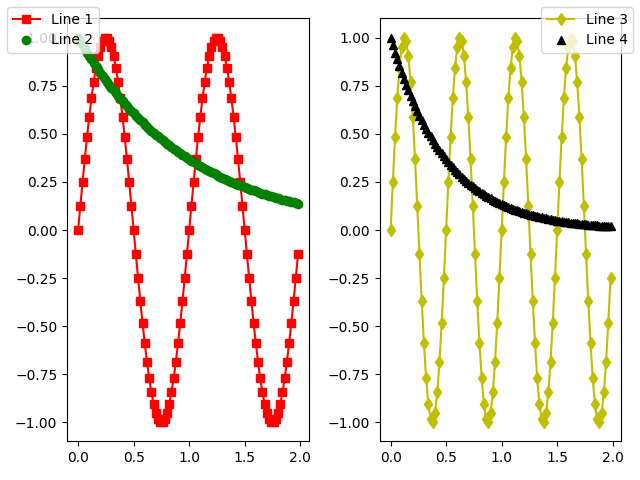
import numpy as np
import matplotlib.pyplot as plt

fig, axs = plt.subplots(1, 2)

x = np.arange(0.0, 2.0, 0.02)
y1 = np.sin(2 * np.pi * x)
y2 = np.exp(-x)
l1, l2 = axs[0].plot(x, y1, 'rs-', x, y2, 'go')

y3 = np.sin(4 * np.pi * x)
y4 = np.exp(-2 * x)
l3, l4 = axs[1].plot(x, y3, 'yd-', x, y4, 'k^')

fig.legend((l1, l2), ('Line 1', 'Line 2'), 'upper left')
fig.legend((l3, l4), ('Line 3', 'Line 4'), 'upper right')

plt.tight_layout()
plt.show()