Version 2.1.2
This exhibits the most basic use of the error bar method. In this case, constant values are provided for the error in both the x- and y-directions.
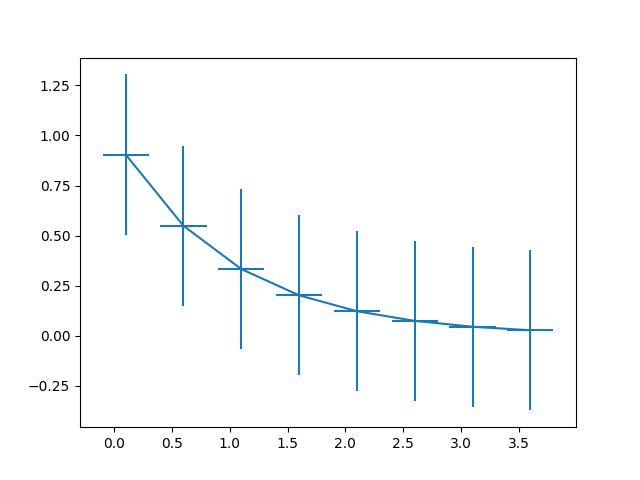
import numpy as np
import matplotlib.pyplot as plt

# example data
x = np.arange(0.1, 4, 0.5)
y = np.exp(-x)

fig, ax = plt.subplots()
ax.errorbar(x, y, xerr=0.2, yerr=0.4)
plt.show()
Total running time of the script: ( 0 minutes 0.020 seconds)
