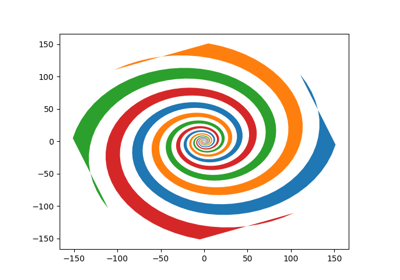
You are reading an old version of the documentation (v2.1.2). For the latest version see https://matplotlib.org/stable/api/_as_gen/matplotlib.pyplot.fill.html
Version 2.1.2
matplotlib
Fork me on GitHub


Travis-CI:

Table Of Contents

This Page

matplotlib.pyplot.fill

matplotlib.pyplot.fill(*args, **kwargs)

Plot filled polygons.

Parameters:

args : sequence of x, y, [color]

Each polygon is defined by the lists of x and y positions of its nodes, optionally followed by by a color specifier. See matplotlib.colors for supported color specifiers. The standard color cycle is used for polygons without a color specifier.

You can plot multiple polygons by providing multiple x, y, [color] groups.

For example, each of the following is legal:

ax.fill(x, y)                    # a polygon with default color
ax.fill(x, y, "b")               # a blue polygon
ax.fill(x, y, x2, y2)            # two polygons
ax.fill(x, y, "b", x2, y2, "r")  # a blue and a red polygon
Returns:

a list of Polygon

Other Parameters:
 

**kwargs : Polygon properties

Notes

Use fill_between() if you would like to fill the region between two curves.

Note

In addition to the above described arguments, this function can take a data keyword argument. If such a data argument is given, the following arguments are replaced by data[<arg>]:

  • All arguments with the following names: ‘x’, ‘y’.

Examples using matplotlib.pyplot.fill