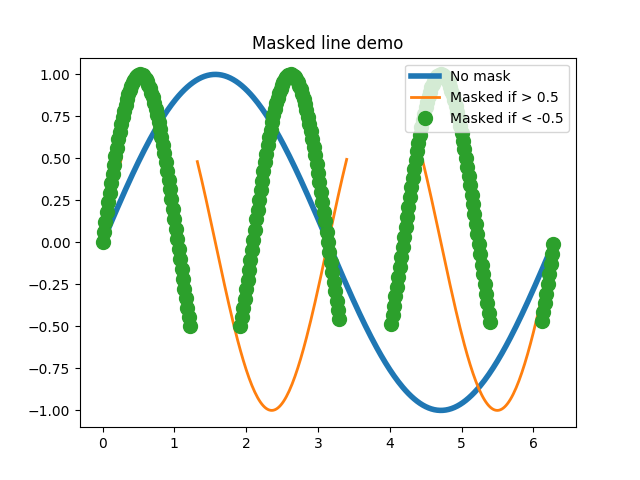
Plot lines with points masked out.
This would typically be used with gappy data, to break the line at the data gaps.
import matplotlib.pyplot as plt
import numpy as np

x = np.arange(0, 2*np.pi, 0.02)
y = np.sin(x)
y1 = np.sin(2*x)
y2 = np.sin(3*x)
ym1 = np.ma.masked_where(y1 > 0.5, y1)
ym2 = np.ma.masked_where(y2 < -0.5, y2)

lines = plt.plot(x, y, x, ym1, x, ym2, 'o')
plt.setp(lines[0], linewidth=4)
plt.setp(lines[1], linewidth=2)
plt.setp(lines[2], markersize=10)

plt.legend(('No mask', 'Masked if > 0.5', 'Masked if < -0.5'),
           loc='upper right')
plt.title('Masked line demo')
plt.show()
Total running time of the script: ( 0 minutes 0.020 seconds)
